Yugoslavian vs Chippewa Hearing Disability
COMPARE
Yugoslavian
Chippewa
Hearing Disability
Hearing Disability Comparison
Yugoslavians
Chippewa
3.3%
HEARING DISABILITY
1.0/ 100
METRIC RATING
242nd/ 347
METRIC RANK
4.0%
HEARING DISABILITY
0.0/ 100
METRIC RATING
319th/ 347
METRIC RANK
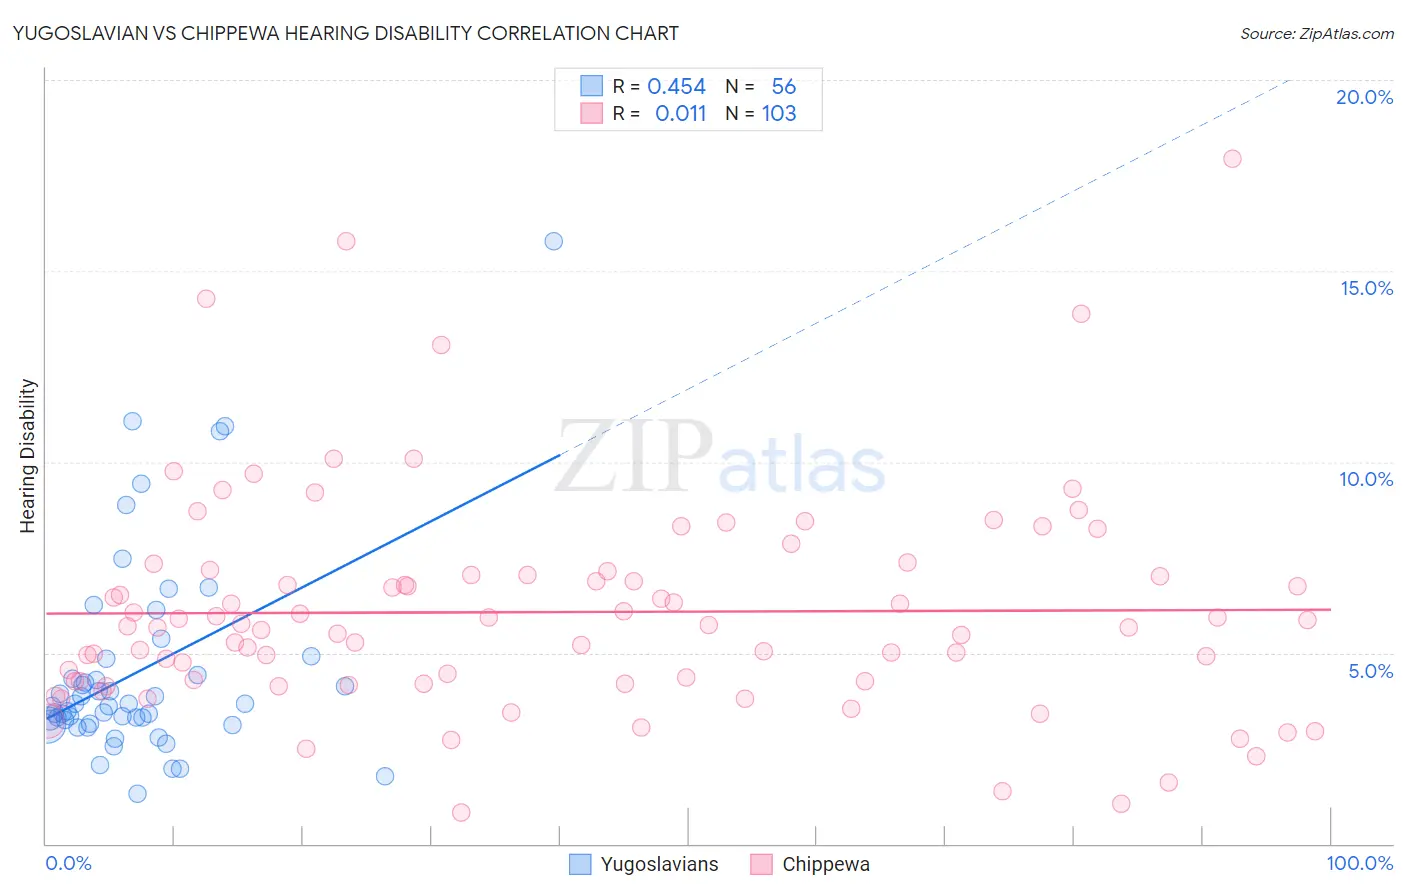
Yugoslavian vs Chippewa Hearing Disability Correlation Chart
The statistical analysis conducted on geographies consisting of 285,663,811 people shows a moderate positive correlation between the proportion of Yugoslavians and percentage of population with hearing disability in the United States with a correlation coefficient (R) of 0.454 and weighted average of 3.3%. Similarly, the statistical analysis conducted on geographies consisting of 215,037,759 people shows no correlation between the proportion of Chippewa and percentage of population with hearing disability in the United States with a correlation coefficient (R) of 0.011 and weighted average of 4.0%, a difference of 20.4%.
Hearing Disability Correlation Summary
| Measurement | Yugoslavian | Chippewa |
| Minimum | 1.3% | 0.81% |
| Maximum | 15.8% | 17.9% |
| Range | 14.5% | 17.1% |
| Mean | 4.5% | 6.1% |
| Median | 3.6% | 5.7% |
| Interquartile 25% (IQ1) | 3.2% | 4.2% |
| Interquartile 75% (IQ3) | 4.6% | 7.0% |
| Interquartile Range (IQR) | 1.5% | 2.8% |
| Standard Deviation (Sample) | 2.7% | 2.9% |
| Standard Deviation (Population) | 2.7% | 2.9% |
Similar Demographics by Hearing Disability
Demographics Similar to Yugoslavians by Hearing Disability
In terms of hearing disability, the demographic groups most similar to Yugoslavians are Samoan (3.3%, a difference of 0.11%), Immigrants from Western Europe (3.3%, a difference of 0.17%), Immigrants from Netherlands (3.3%, a difference of 0.18%), Assyrian/Chaldean/Syriac (3.3%, a difference of 0.24%), and Nepalese (3.3%, a difference of 0.36%).
| Demographics | Rating | Rank | Hearing Disability |
| Guamanians/Chamorros | 2.2 /100 | #235 | Tragic 3.3% |
| Serbians | 2.2 /100 | #236 | Tragic 3.3% |
| Immigrants | Austria | 1.8 /100 | #237 | Tragic 3.3% |
| German Russians | 1.8 /100 | #238 | Tragic 3.3% |
| Nepalese | 1.2 /100 | #239 | Tragic 3.3% |
| Immigrants | Netherlands | 1.1 /100 | #240 | Tragic 3.3% |
| Samoans | 1.1 /100 | #241 | Tragic 3.3% |
| Yugoslavians | 1.0 /100 | #242 | Tragic 3.3% |
| Immigrants | Western Europe | 1.0 /100 | #243 | Tragic 3.3% |
| Assyrians/Chaldeans/Syriacs | 0.9 /100 | #244 | Tragic 3.3% |
| Immigrants | Scotland | 0.8 /100 | #245 | Tragic 3.3% |
| Immigrants | England | 0.7 /100 | #246 | Tragic 3.3% |
| Lithuanians | 0.6 /100 | #247 | Tragic 3.4% |
| Austrians | 0.6 /100 | #248 | Tragic 3.4% |
| Italians | 0.4 /100 | #249 | Tragic 3.4% |
Demographics Similar to Chippewa by Hearing Disability
In terms of hearing disability, the demographic groups most similar to Chippewa are Cheyenne (4.0%, a difference of 0.65%), Shoshone (4.0%, a difference of 0.81%), Comanche (4.0%, a difference of 0.82%), Spanish American (4.0%, a difference of 0.95%), and Puget Sound Salish (3.9%, a difference of 1.1%).
| Demographics | Rating | Rank | Hearing Disability |
| Cajuns | 0.0 /100 | #312 | Tragic 3.9% |
| Hopi | 0.0 /100 | #313 | Tragic 3.9% |
| Yakama | 0.0 /100 | #314 | Tragic 3.9% |
| Puget Sound Salish | 0.0 /100 | #315 | Tragic 3.9% |
| Spanish Americans | 0.0 /100 | #316 | Tragic 4.0% |
| Comanche | 0.0 /100 | #317 | Tragic 4.0% |
| Cheyenne | 0.0 /100 | #318 | Tragic 4.0% |
| Chippewa | 0.0 /100 | #319 | Tragic 4.0% |
| Shoshone | 0.0 /100 | #320 | Tragic 4.0% |
| Paiute | 0.0 /100 | #321 | Tragic 4.1% |
| Seminole | 0.0 /100 | #322 | Tragic 4.1% |
| Apache | 0.0 /100 | #323 | Tragic 4.1% |
| Osage | 0.0 /100 | #324 | Tragic 4.1% |
| Lumbee | 0.0 /100 | #325 | Tragic 4.1% |
| Potawatomi | 0.0 /100 | #326 | Tragic 4.1% |