Yugoslavian vs Guatemalan Hearing Disability
COMPARE
Yugoslavian
Guatemalan
Hearing Disability
Hearing Disability Comparison
Yugoslavians
Guatemalans
3.3%
HEARING DISABILITY
1.0/ 100
METRIC RATING
242nd/ 347
METRIC RANK
2.8%
HEARING DISABILITY
93.2/ 100
METRIC RATING
108th/ 347
METRIC RANK
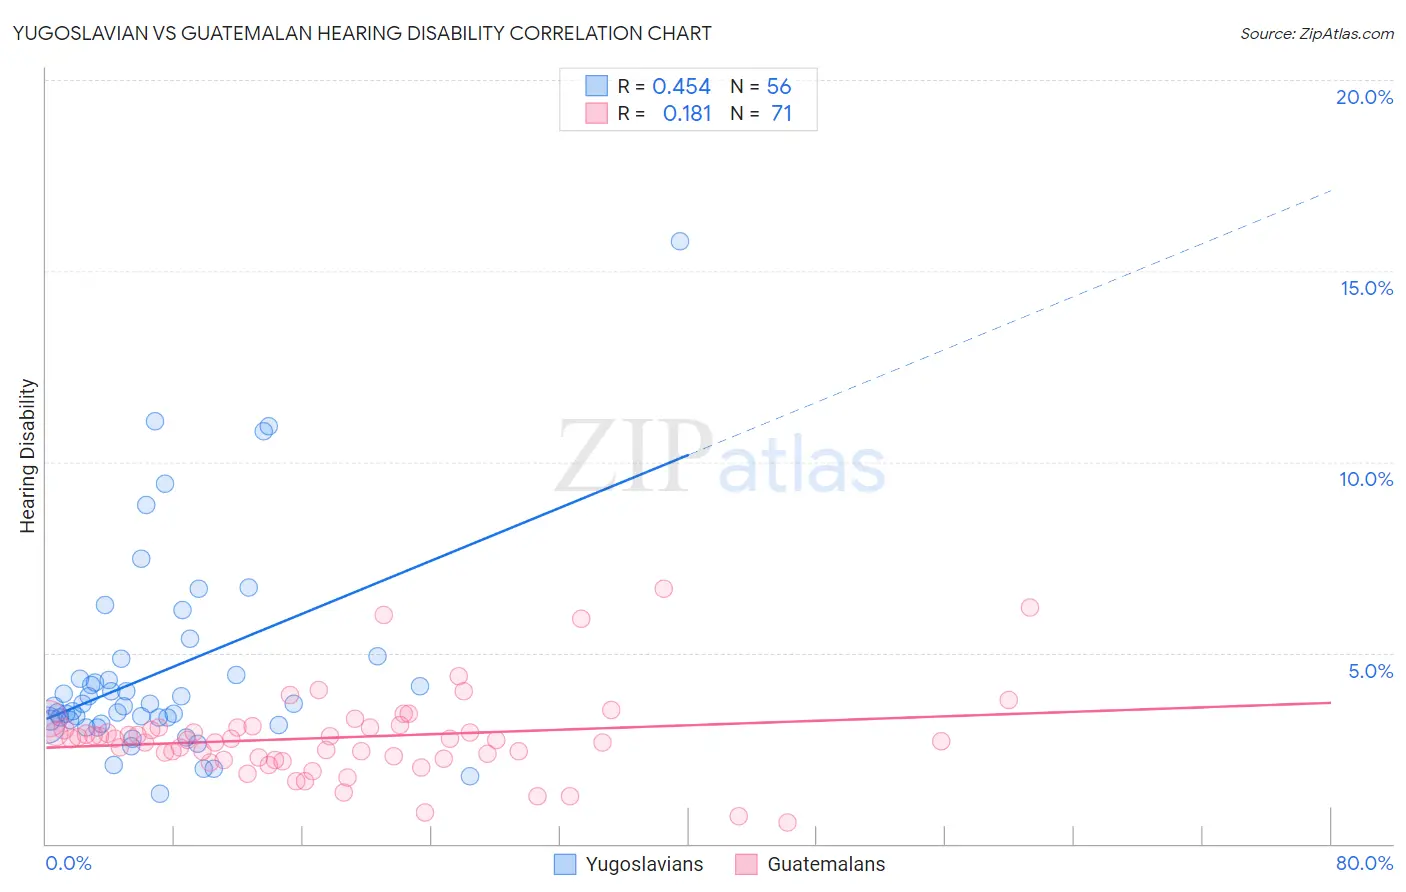
Yugoslavian vs Guatemalan Hearing Disability Correlation Chart
The statistical analysis conducted on geographies consisting of 285,663,811 people shows a moderate positive correlation between the proportion of Yugoslavians and percentage of population with hearing disability in the United States with a correlation coefficient (R) of 0.454 and weighted average of 3.3%. Similarly, the statistical analysis conducted on geographies consisting of 409,374,057 people shows a poor positive correlation between the proportion of Guatemalans and percentage of population with hearing disability in the United States with a correlation coefficient (R) of 0.181 and weighted average of 2.8%, a difference of 17.9%.
Hearing Disability Correlation Summary
| Measurement | Yugoslavian | Guatemalan |
| Minimum | 1.3% | 0.55% |
| Maximum | 15.8% | 6.7% |
| Range | 14.5% | 6.1% |
| Mean | 4.5% | 2.8% |
| Median | 3.6% | 2.7% |
| Interquartile 25% (IQ1) | 3.2% | 2.2% |
| Interquartile 75% (IQ3) | 4.6% | 3.0% |
| Interquartile Range (IQR) | 1.5% | 0.81% |
| Standard Deviation (Sample) | 2.7% | 1.1% |
| Standard Deviation (Population) | 2.7% | 1.1% |
Similar Demographics by Hearing Disability
Demographics Similar to Yugoslavians by Hearing Disability
In terms of hearing disability, the demographic groups most similar to Yugoslavians are Samoan (3.3%, a difference of 0.11%), Immigrants from Western Europe (3.3%, a difference of 0.17%), Immigrants from Netherlands (3.3%, a difference of 0.18%), Assyrian/Chaldean/Syriac (3.3%, a difference of 0.24%), and Nepalese (3.3%, a difference of 0.36%).
| Demographics | Rating | Rank | Hearing Disability |
| Guamanians/Chamorros | 2.2 /100 | #235 | Tragic 3.3% |
| Serbians | 2.2 /100 | #236 | Tragic 3.3% |
| Immigrants | Austria | 1.8 /100 | #237 | Tragic 3.3% |
| German Russians | 1.8 /100 | #238 | Tragic 3.3% |
| Nepalese | 1.2 /100 | #239 | Tragic 3.3% |
| Immigrants | Netherlands | 1.1 /100 | #240 | Tragic 3.3% |
| Samoans | 1.1 /100 | #241 | Tragic 3.3% |
| Yugoslavians | 1.0 /100 | #242 | Tragic 3.3% |
| Immigrants | Western Europe | 1.0 /100 | #243 | Tragic 3.3% |
| Assyrians/Chaldeans/Syriacs | 0.9 /100 | #244 | Tragic 3.3% |
| Immigrants | Scotland | 0.8 /100 | #245 | Tragic 3.3% |
| Immigrants | England | 0.7 /100 | #246 | Tragic 3.3% |
| Lithuanians | 0.6 /100 | #247 | Tragic 3.4% |
| Austrians | 0.6 /100 | #248 | Tragic 3.4% |
| Italians | 0.4 /100 | #249 | Tragic 3.4% |
Demographics Similar to Guatemalans by Hearing Disability
In terms of hearing disability, the demographic groups most similar to Guatemalans are Turkish (2.8%, a difference of 0.070%), Honduran (2.8%, a difference of 0.080%), Immigrants from Chile (2.8%, a difference of 0.080%), Cypriot (2.8%, a difference of 0.12%), and Immigrants from Yemen (2.8%, a difference of 0.17%).
| Demographics | Rating | Rank | Hearing Disability |
| Immigrants | Spain | 94.9 /100 | #101 | Exceptional 2.8% |
| Taiwanese | 94.8 /100 | #102 | Exceptional 2.8% |
| Immigrants | Indonesia | 94.7 /100 | #103 | Exceptional 2.8% |
| Burmese | 94.2 /100 | #104 | Exceptional 2.8% |
| Moroccans | 93.9 /100 | #105 | Exceptional 2.8% |
| Hondurans | 93.4 /100 | #106 | Exceptional 2.8% |
| Immigrants | Chile | 93.4 /100 | #107 | Exceptional 2.8% |
| Guatemalans | 93.2 /100 | #108 | Exceptional 2.8% |
| Turks | 93.0 /100 | #109 | Exceptional 2.8% |
| Cypriots | 92.9 /100 | #110 | Exceptional 2.8% |
| Immigrants | Yemen | 92.7 /100 | #111 | Exceptional 2.8% |
| U.S. Virgin Islanders | 92.5 /100 | #112 | Exceptional 2.8% |
| Immigrants | Belarus | 91.6 /100 | #113 | Exceptional 2.8% |
| Cambodians | 91.1 /100 | #114 | Exceptional 2.8% |
| Immigrants | Latin America | 90.5 /100 | #115 | Exceptional 2.8% |