Immigrants from Dominican Republic vs Guatemalan Hearing Disability
COMPARE
Immigrants from Dominican Republic
Guatemalan
Hearing Disability
Hearing Disability Comparison
Immigrants from Dominican Republic
Guatemalans
2.4%
HEARING DISABILITY
100.0/ 100
METRIC RATING
9th/ 347
METRIC RANK
2.8%
HEARING DISABILITY
93.2/ 100
METRIC RATING
108th/ 347
METRIC RANK
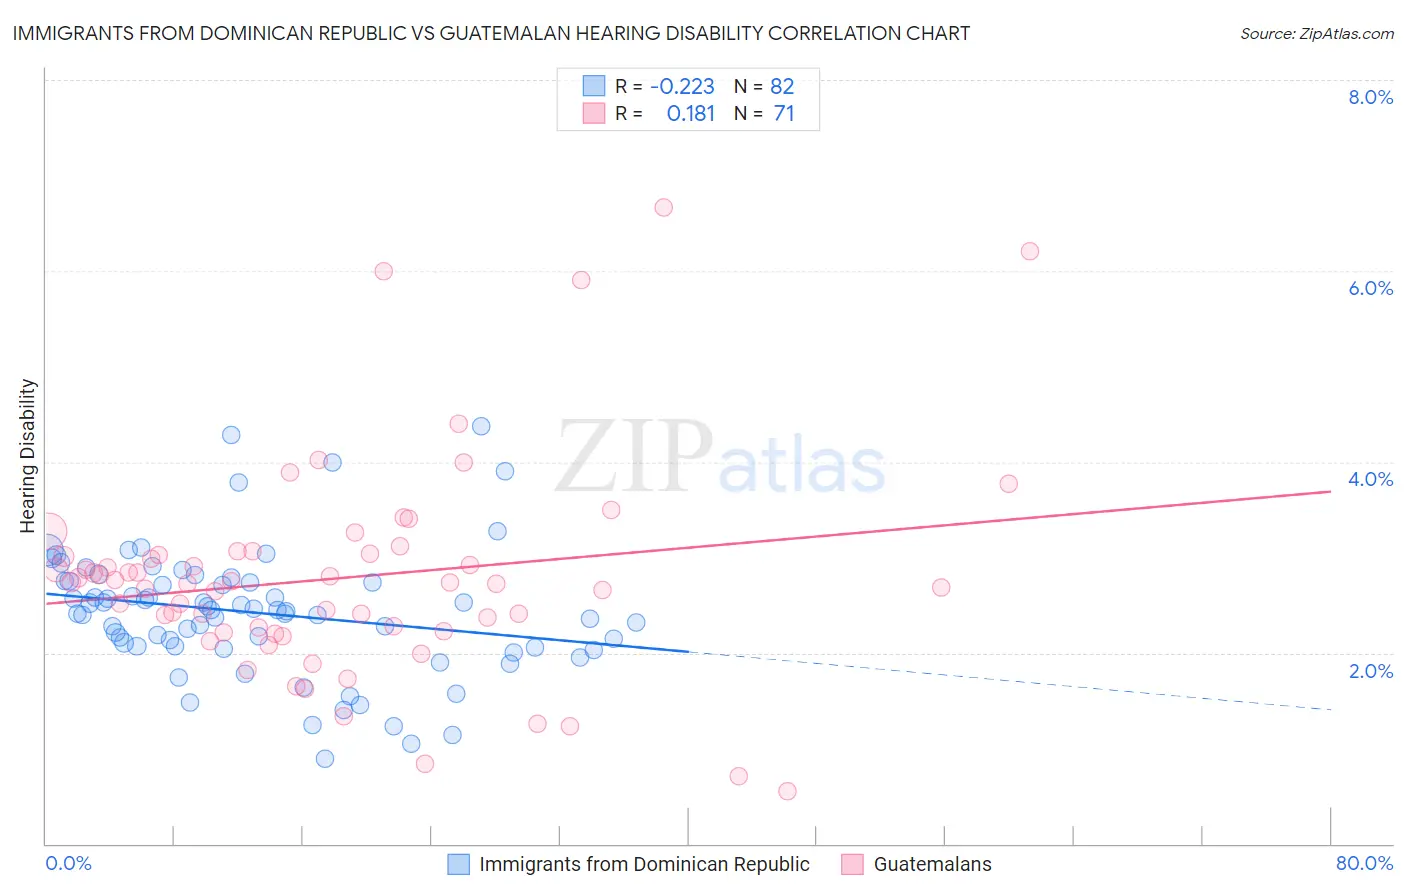
Immigrants from Dominican Republic vs Guatemalan Hearing Disability Correlation Chart
The statistical analysis conducted on geographies consisting of 275,054,996 people shows a weak negative correlation between the proportion of Immigrants from Dominican Republic and percentage of population with hearing disability in the United States with a correlation coefficient (R) of -0.223 and weighted average of 2.4%. Similarly, the statistical analysis conducted on geographies consisting of 409,374,057 people shows a poor positive correlation between the proportion of Guatemalans and percentage of population with hearing disability in the United States with a correlation coefficient (R) of 0.181 and weighted average of 2.8%, a difference of 14.8%.
Hearing Disability Correlation Summary
| Measurement | Immigrants from Dominican Republic | Guatemalan |
| Minimum | 0.89% | 0.55% |
| Maximum | 4.4% | 6.7% |
| Range | 3.5% | 6.1% |
| Mean | 2.4% | 2.8% |
| Median | 2.4% | 2.7% |
| Interquartile 25% (IQ1) | 2.1% | 2.2% |
| Interquartile 75% (IQ3) | 2.8% | 3.0% |
| Interquartile Range (IQR) | 0.69% | 0.81% |
| Standard Deviation (Sample) | 0.66% | 1.1% |
| Standard Deviation (Population) | 0.66% | 1.1% |
Similar Demographics by Hearing Disability
Demographics Similar to Immigrants from Dominican Republic by Hearing Disability
In terms of hearing disability, the demographic groups most similar to Immigrants from Dominican Republic are British West Indian (2.4%, a difference of 0.78%), Immigrants from Bangladesh (2.4%, a difference of 1.0%), Immigrants from Ecuador (2.5%, a difference of 1.0%), Immigrants from Trinidad and Tobago (2.5%, a difference of 1.6%), and Trinidadian and Tobagonian (2.5%, a difference of 1.9%).
| Demographics | Rating | Rank | Hearing Disability |
| Immigrants | St. Vincent and the Grenadines | 100.0 /100 | #2 | Exceptional 2.3% |
| Guyanese | 100.0 /100 | #3 | Exceptional 2.3% |
| Immigrants | Guyana | 100.0 /100 | #4 | Exceptional 2.3% |
| Immigrants | Barbados | 100.0 /100 | #5 | Exceptional 2.4% |
| Vietnamese | 100.0 /100 | #6 | Exceptional 2.4% |
| Immigrants | Bangladesh | 100.0 /100 | #7 | Exceptional 2.4% |
| British West Indians | 100.0 /100 | #8 | Exceptional 2.4% |
| Immigrants | Dominican Republic | 100.0 /100 | #9 | Exceptional 2.4% |
| Immigrants | Ecuador | 99.9 /100 | #10 | Exceptional 2.5% |
| Immigrants | Trinidad and Tobago | 99.9 /100 | #11 | Exceptional 2.5% |
| Trinidadians and Tobagonians | 99.9 /100 | #12 | Exceptional 2.5% |
| Sierra Leoneans | 99.9 /100 | #13 | Exceptional 2.5% |
| Ecuadorians | 99.9 /100 | #14 | Exceptional 2.5% |
| Barbadians | 99.9 /100 | #15 | Exceptional 2.5% |
| Immigrants | West Indies | 99.9 /100 | #16 | Exceptional 2.5% |
Demographics Similar to Guatemalans by Hearing Disability
In terms of hearing disability, the demographic groups most similar to Guatemalans are Turkish (2.8%, a difference of 0.070%), Honduran (2.8%, a difference of 0.080%), Immigrants from Chile (2.8%, a difference of 0.080%), Cypriot (2.8%, a difference of 0.12%), and Immigrants from Yemen (2.8%, a difference of 0.17%).
| Demographics | Rating | Rank | Hearing Disability |
| Immigrants | Spain | 94.9 /100 | #101 | Exceptional 2.8% |
| Taiwanese | 94.8 /100 | #102 | Exceptional 2.8% |
| Immigrants | Indonesia | 94.7 /100 | #103 | Exceptional 2.8% |
| Burmese | 94.2 /100 | #104 | Exceptional 2.8% |
| Moroccans | 93.9 /100 | #105 | Exceptional 2.8% |
| Hondurans | 93.4 /100 | #106 | Exceptional 2.8% |
| Immigrants | Chile | 93.4 /100 | #107 | Exceptional 2.8% |
| Guatemalans | 93.2 /100 | #108 | Exceptional 2.8% |
| Turks | 93.0 /100 | #109 | Exceptional 2.8% |
| Cypriots | 92.9 /100 | #110 | Exceptional 2.8% |
| Immigrants | Yemen | 92.7 /100 | #111 | Exceptional 2.8% |
| U.S. Virgin Islanders | 92.5 /100 | #112 | Exceptional 2.8% |
| Immigrants | Belarus | 91.6 /100 | #113 | Exceptional 2.8% |
| Cambodians | 91.1 /100 | #114 | Exceptional 2.8% |
| Immigrants | Latin America | 90.5 /100 | #115 | Exceptional 2.8% |