Australian vs Guatemalan Hearing Disability
COMPARE
Australian
Guatemalan
Hearing Disability
Hearing Disability Comparison
Australians
Guatemalans
3.2%
HEARING DISABILITY
8.1/ 100
METRIC RATING
214th/ 347
METRIC RANK
2.8%
HEARING DISABILITY
93.2/ 100
METRIC RATING
108th/ 347
METRIC RANK
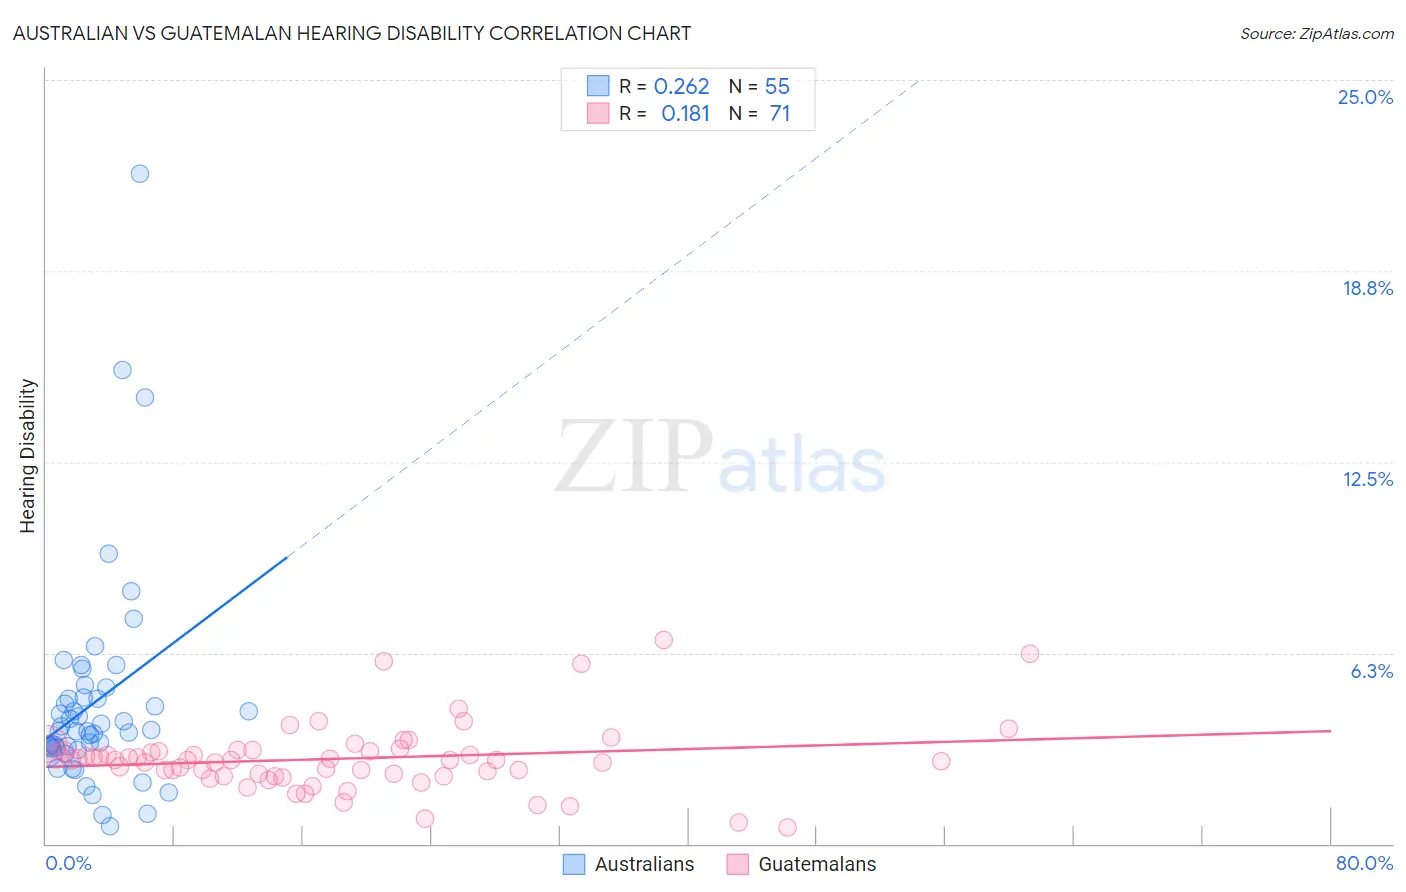
Australian vs Guatemalan Hearing Disability Correlation Chart
The statistical analysis conducted on geographies consisting of 224,103,986 people shows a weak positive correlation between the proportion of Australians and percentage of population with hearing disability in the United States with a correlation coefficient (R) of 0.262 and weighted average of 3.2%. Similarly, the statistical analysis conducted on geographies consisting of 409,374,057 people shows a poor positive correlation between the proportion of Guatemalans and percentage of population with hearing disability in the United States with a correlation coefficient (R) of 0.181 and weighted average of 2.8%, a difference of 12.6%.
Hearing Disability Correlation Summary
| Measurement | Australian | Guatemalan |
| Minimum | 0.57% | 0.55% |
| Maximum | 21.9% | 6.7% |
| Range | 21.4% | 6.1% |
| Mean | 4.6% | 2.8% |
| Median | 3.7% | 2.7% |
| Interquartile 25% (IQ1) | 3.1% | 2.2% |
| Interquartile 75% (IQ3) | 4.8% | 3.0% |
| Interquartile Range (IQR) | 1.7% | 0.81% |
| Standard Deviation (Sample) | 3.6% | 1.1% |
| Standard Deviation (Population) | 3.6% | 1.1% |
Similar Demographics by Hearing Disability
Demographics Similar to Australians by Hearing Disability
In terms of hearing disability, the demographic groups most similar to Australians are Bangladeshi (3.2%, a difference of 0.010%), Immigrants from Norway (3.2%, a difference of 0.25%), Russian (3.2%, a difference of 0.33%), Immigrants from Northern Europe (3.2%, a difference of 0.37%), and New Zealander (3.2%, a difference of 0.43%).
| Demographics | Rating | Rank | Hearing Disability |
| Hispanics or Latinos | 15.1 /100 | #207 | Poor 3.1% |
| Immigrants | Latvia | 12.7 /100 | #208 | Poor 3.1% |
| Immigrants | Hungary | 12.5 /100 | #209 | Poor 3.1% |
| Cape Verdeans | 12.2 /100 | #210 | Poor 3.1% |
| Romanians | 12.1 /100 | #211 | Poor 3.1% |
| Pakistanis | 11.1 /100 | #212 | Poor 3.1% |
| Immigrants | Iraq | 10.5 /100 | #213 | Poor 3.1% |
| Australians | 8.1 /100 | #214 | Tragic 3.2% |
| Bangladeshis | 8.1 /100 | #215 | Tragic 3.2% |
| Immigrants | Norway | 7.3 /100 | #216 | Tragic 3.2% |
| Russians | 7.1 /100 | #217 | Tragic 3.2% |
| Immigrants | Northern Europe | 7.0 /100 | #218 | Tragic 3.2% |
| New Zealanders | 6.8 /100 | #219 | Tragic 3.2% |
| Malaysians | 6.6 /100 | #220 | Tragic 3.2% |
| Immigrants | Laos | 6.6 /100 | #221 | Tragic 3.2% |
Demographics Similar to Guatemalans by Hearing Disability
In terms of hearing disability, the demographic groups most similar to Guatemalans are Turkish (2.8%, a difference of 0.070%), Honduran (2.8%, a difference of 0.080%), Immigrants from Chile (2.8%, a difference of 0.080%), Cypriot (2.8%, a difference of 0.12%), and Immigrants from Yemen (2.8%, a difference of 0.17%).
| Demographics | Rating | Rank | Hearing Disability |
| Immigrants | Spain | 94.9 /100 | #101 | Exceptional 2.8% |
| Taiwanese | 94.8 /100 | #102 | Exceptional 2.8% |
| Immigrants | Indonesia | 94.7 /100 | #103 | Exceptional 2.8% |
| Burmese | 94.2 /100 | #104 | Exceptional 2.8% |
| Moroccans | 93.9 /100 | #105 | Exceptional 2.8% |
| Hondurans | 93.4 /100 | #106 | Exceptional 2.8% |
| Immigrants | Chile | 93.4 /100 | #107 | Exceptional 2.8% |
| Guatemalans | 93.2 /100 | #108 | Exceptional 2.8% |
| Turks | 93.0 /100 | #109 | Exceptional 2.8% |
| Cypriots | 92.9 /100 | #110 | Exceptional 2.8% |
| Immigrants | Yemen | 92.7 /100 | #111 | Exceptional 2.8% |
| U.S. Virgin Islanders | 92.5 /100 | #112 | Exceptional 2.8% |
| Immigrants | Belarus | 91.6 /100 | #113 | Exceptional 2.8% |
| Cambodians | 91.1 /100 | #114 | Exceptional 2.8% |
| Immigrants | Latin America | 90.5 /100 | #115 | Exceptional 2.8% |