Yugoslavian vs Guatemalan Female Disability
COMPARE
Yugoslavian
Guatemalan
Female Disability
Female Disability Comparison
Yugoslavians
Guatemalans
12.6%
FEMALE DISABILITY
3.7/ 100
METRIC RATING
238th/ 347
METRIC RANK
12.1%
FEMALE DISABILITY
63.8/ 100
METRIC RATING
163rd/ 347
METRIC RANK
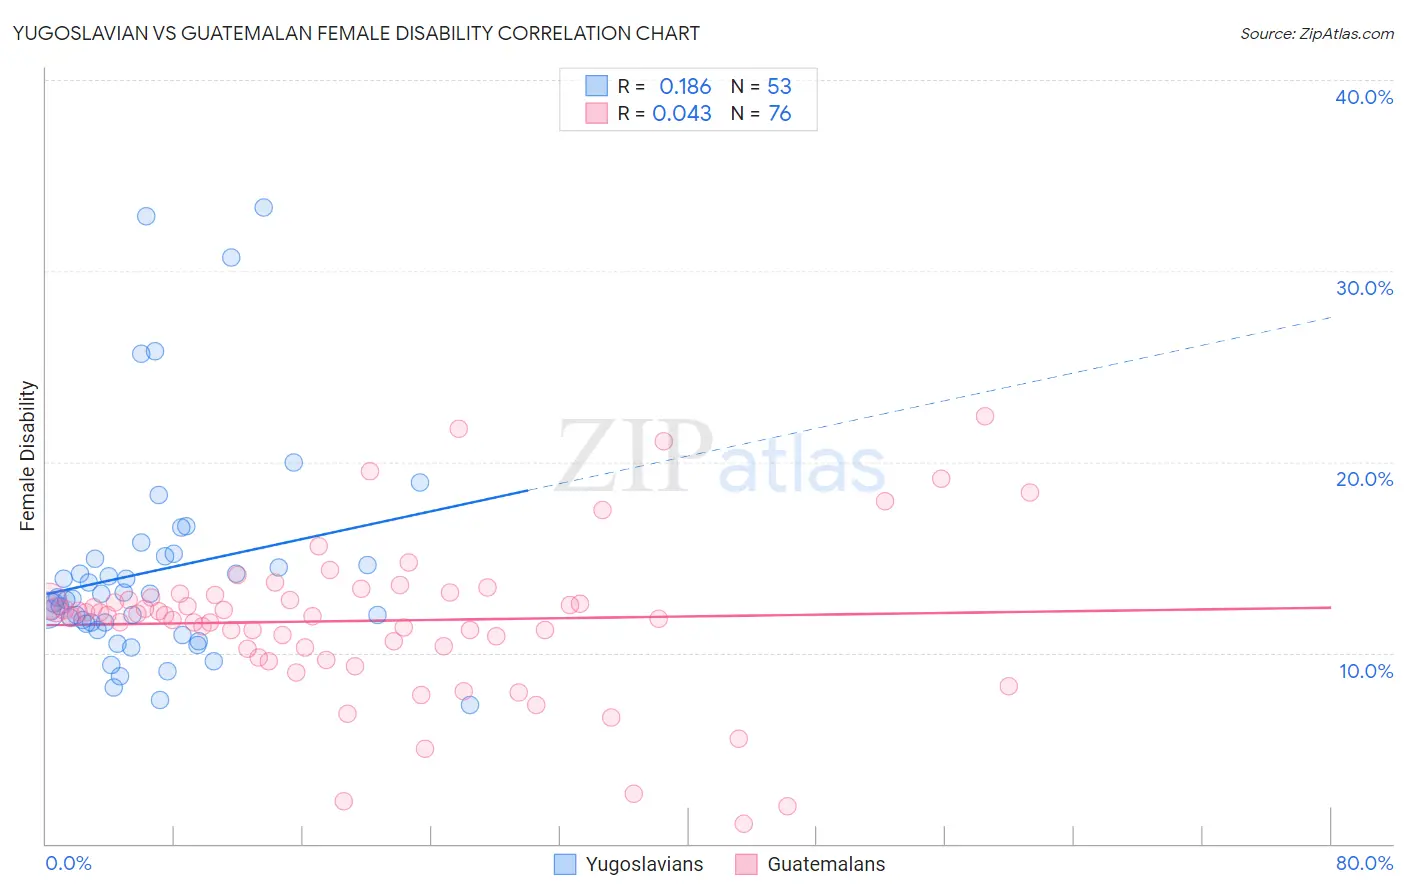
Yugoslavian vs Guatemalan Female Disability Correlation Chart
The statistical analysis conducted on geographies consisting of 285,691,291 people shows a poor positive correlation between the proportion of Yugoslavians and percentage of females with a disability in the United States with a correlation coefficient (R) of 0.186 and weighted average of 12.6%. Similarly, the statistical analysis conducted on geographies consisting of 409,476,424 people shows no correlation between the proportion of Guatemalans and percentage of females with a disability in the United States with a correlation coefficient (R) of 0.043 and weighted average of 12.1%, a difference of 3.6%.
Female Disability Correlation Summary
| Measurement | Yugoslavian | Guatemalan |
| Minimum | 7.3% | 1.0% |
| Maximum | 33.3% | 22.4% |
| Range | 26.1% | 21.4% |
| Mean | 14.3% | 11.7% |
| Median | 12.9% | 12.0% |
| Interquartile 25% (IQ1) | 11.4% | 10.2% |
| Interquartile 75% (IQ3) | 15.0% | 13.0% |
| Interquartile Range (IQR) | 3.6% | 2.7% |
| Standard Deviation (Sample) | 5.7% | 4.0% |
| Standard Deviation (Population) | 5.7% | 4.0% |
Similar Demographics by Female Disability
Demographics Similar to Yugoslavians by Female Disability
In terms of female disability, the demographic groups most similar to Yugoslavians are Slavic (12.6%, a difference of 0.030%), Barbadian (12.6%, a difference of 0.030%), German Russian (12.6%, a difference of 0.13%), Immigrants from West Indies (12.6%, a difference of 0.15%), and Malaysian (12.5%, a difference of 0.28%).
| Demographics | Rating | Rank | Female Disability |
| Belgians | 6.5 /100 | #231 | Tragic 12.5% |
| Immigrants | Somalia | 5.9 /100 | #232 | Tragic 12.5% |
| Immigrants | Iraq | 5.3 /100 | #233 | Tragic 12.5% |
| Scandinavians | 5.3 /100 | #234 | Tragic 12.5% |
| Malaysians | 5.0 /100 | #235 | Tragic 12.5% |
| Immigrants | West Indies | 4.4 /100 | #236 | Tragic 12.6% |
| Slavs | 3.8 /100 | #237 | Tragic 12.6% |
| Yugoslavians | 3.7 /100 | #238 | Tragic 12.6% |
| Barbadians | 3.6 /100 | #239 | Tragic 12.6% |
| German Russians | 3.2 /100 | #240 | Tragic 12.6% |
| Japanese | 2.7 /100 | #241 | Tragic 12.6% |
| Canadians | 2.6 /100 | #242 | Tragic 12.6% |
| Immigrants | Senegal | 2.5 /100 | #243 | Tragic 12.6% |
| Alsatians | 2.5 /100 | #244 | Tragic 12.6% |
| Immigrants | Jamaica | 2.2 /100 | #245 | Tragic 12.6% |
Demographics Similar to Guatemalans by Female Disability
In terms of female disability, the demographic groups most similar to Guatemalans are Czech (12.1%, a difference of 0.010%), Immigrants from Ukraine (12.1%, a difference of 0.020%), Guyanese (12.1%, a difference of 0.030%), Immigrants from Oceania (12.1%, a difference of 0.080%), and Immigrants from Guatemala (12.1%, a difference of 0.090%).
| Demographics | Rating | Rank | Female Disability |
| Moroccans | 72.9 /100 | #156 | Good 12.1% |
| Danes | 72.5 /100 | #157 | Good 12.1% |
| Immigrants | Middle Africa | 72.4 /100 | #158 | Good 12.1% |
| Immigrants | Central America | 67.7 /100 | #159 | Good 12.1% |
| Immigrants | Guatemala | 66.0 /100 | #160 | Good 12.1% |
| Guyanese | 64.7 /100 | #161 | Good 12.1% |
| Immigrants | Ukraine | 64.3 /100 | #162 | Good 12.1% |
| Guatemalans | 63.8 /100 | #163 | Good 12.1% |
| Czechs | 63.6 /100 | #164 | Good 12.1% |
| Immigrants | Oceania | 61.8 /100 | #165 | Good 12.1% |
| Lithuanians | 59.5 /100 | #166 | Average 12.2% |
| Immigrants | Latin America | 59.0 /100 | #167 | Average 12.2% |
| Immigrants | Haiti | 58.8 /100 | #168 | Average 12.2% |
| Lebanese | 58.1 /100 | #169 | Average 12.2% |
| Maltese | 57.0 /100 | #170 | Average 12.2% |