Immigrants from Iraq vs Vietnamese Male Disability
COMPARE
Immigrants from Iraq
Vietnamese
Male Disability
Male Disability Comparison
Immigrants from Iraq
Vietnamese
11.5%
MALE DISABILITY
13.0/ 100
METRIC RATING
200th/ 347
METRIC RANK
10.1%
MALE DISABILITY
99.9/ 100
METRIC RATING
28th/ 347
METRIC RANK
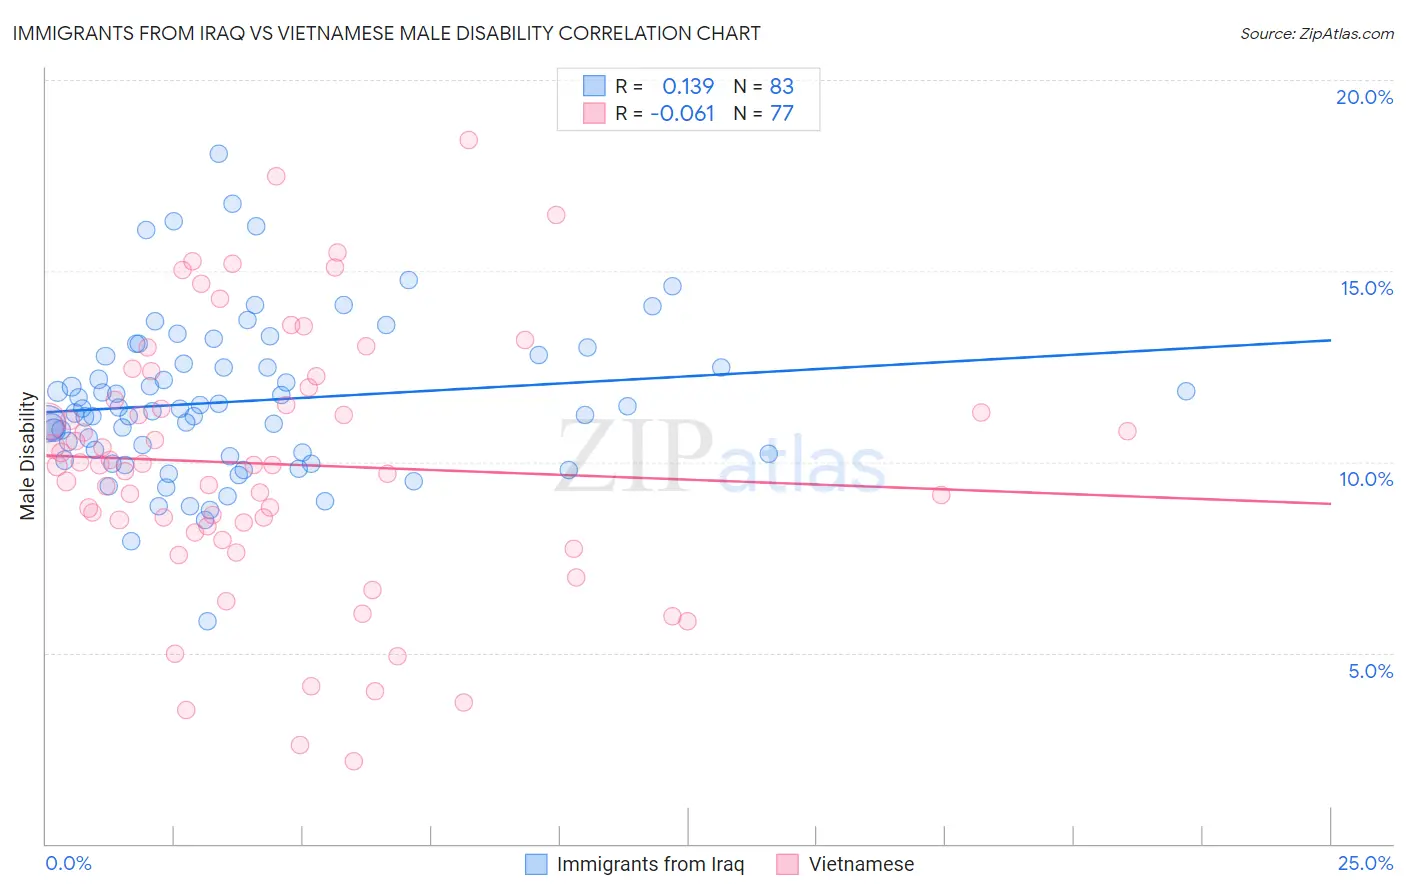
Immigrants from Iraq vs Vietnamese Male Disability Correlation Chart
The statistical analysis conducted on geographies consisting of 194,768,899 people shows a poor positive correlation between the proportion of Immigrants from Iraq and percentage of males with a disability in the United States with a correlation coefficient (R) of 0.139 and weighted average of 11.5%. Similarly, the statistical analysis conducted on geographies consisting of 170,755,013 people shows a slight negative correlation between the proportion of Vietnamese and percentage of males with a disability in the United States with a correlation coefficient (R) of -0.061 and weighted average of 10.1%, a difference of 14.1%.
Male Disability Correlation Summary
| Measurement | Immigrants from Iraq | Vietnamese |
| Minimum | 5.8% | 2.1% |
| Maximum | 18.1% | 18.4% |
| Range | 12.2% | 16.3% |
| Mean | 11.6% | 9.9% |
| Median | 11.4% | 9.9% |
| Interquartile 25% (IQ1) | 10.2% | 8.2% |
| Interquartile 75% (IQ3) | 12.8% | 11.8% |
| Interquartile Range (IQR) | 2.6% | 3.6% |
| Standard Deviation (Sample) | 2.1% | 3.4% |
| Standard Deviation (Population) | 2.1% | 3.4% |
Similar Demographics by Male Disability
Demographics Similar to Immigrants from Iraq by Male Disability
In terms of male disability, the demographic groups most similar to Immigrants from Iraq are Immigrants from Panama (11.5%, a difference of 0.0%), Immigrants from Mexico (11.5%, a difference of 0.040%), Lebanese (11.5%, a difference of 0.27%), Jamaican (11.5%, a difference of 0.27%), and Immigrants from Cambodia (11.5%, a difference of 0.29%).
| Demographics | Rating | Rank | Male Disability |
| Greeks | 22.2 /100 | #193 | Fair 11.4% |
| Belizeans | 21.2 /100 | #194 | Fair 11.4% |
| Immigrants | Oceania | 20.9 /100 | #195 | Fair 11.4% |
| West Indians | 18.4 /100 | #196 | Poor 11.4% |
| Somalis | 18.2 /100 | #197 | Poor 11.4% |
| Immigrants | Jamaica | 16.3 /100 | #198 | Poor 11.5% |
| Lebanese | 15.4 /100 | #199 | Poor 11.5% |
| Immigrants | Iraq | 13.0 /100 | #200 | Poor 11.5% |
| Immigrants | Panama | 13.0 /100 | #201 | Poor 11.5% |
| Immigrants | Mexico | 12.6 /100 | #202 | Poor 11.5% |
| Jamaicans | 10.9 /100 | #203 | Poor 11.5% |
| Immigrants | Cambodia | 10.8 /100 | #204 | Poor 11.5% |
| Serbians | 10.7 /100 | #205 | Poor 11.5% |
| Ukrainians | 10.6 /100 | #206 | Poor 11.5% |
| Immigrants | Somalia | 10.4 /100 | #207 | Poor 11.5% |
Demographics Similar to Vietnamese by Male Disability
In terms of male disability, the demographic groups most similar to Vietnamese are Egyptian (10.1%, a difference of 0.020%), Venezuelan (10.1%, a difference of 0.15%), Immigrants from Egypt (10.1%, a difference of 0.19%), Soviet Union (10.1%, a difference of 0.26%), and Paraguayan (10.1%, a difference of 0.34%).
| Demographics | Rating | Rank | Male Disability |
| Burmese | 100.0 /100 | #21 | Exceptional 10.0% |
| Immigrants | Venezuela | 100.0 /100 | #22 | Exceptional 10.0% |
| Cypriots | 100.0 /100 | #23 | Exceptional 10.0% |
| Immigrants | Asia | 100.0 /100 | #24 | Exceptional 10.0% |
| Immigrants | Malaysia | 99.9 /100 | #25 | Exceptional 10.0% |
| Paraguayans | 99.9 /100 | #26 | Exceptional 10.1% |
| Egyptians | 99.9 /100 | #27 | Exceptional 10.1% |
| Vietnamese | 99.9 /100 | #28 | Exceptional 10.1% |
| Venezuelans | 99.9 /100 | #29 | Exceptional 10.1% |
| Immigrants | Egypt | 99.9 /100 | #30 | Exceptional 10.1% |
| Soviet Union | 99.9 /100 | #31 | Exceptional 10.1% |
| Argentineans | 99.9 /100 | #32 | Exceptional 10.1% |
| Immigrants | Ethiopia | 99.9 /100 | #33 | Exceptional 10.2% |
| Immigrants | Turkey | 99.9 /100 | #34 | Exceptional 10.2% |
| Immigrants | Argentina | 99.9 /100 | #35 | Exceptional 10.2% |