Yaqui vs Vietnamese 6th Grade
COMPARE
Yaqui
Vietnamese
6th Grade
6th Grade Comparison
Yaqui
Vietnamese
96.3%
6TH GRADE
0.1/ 100
METRIC RATING
276th/ 347
METRIC RANK
95.3%
6TH GRADE
0.0/ 100
METRIC RATING
317th/ 347
METRIC RANK
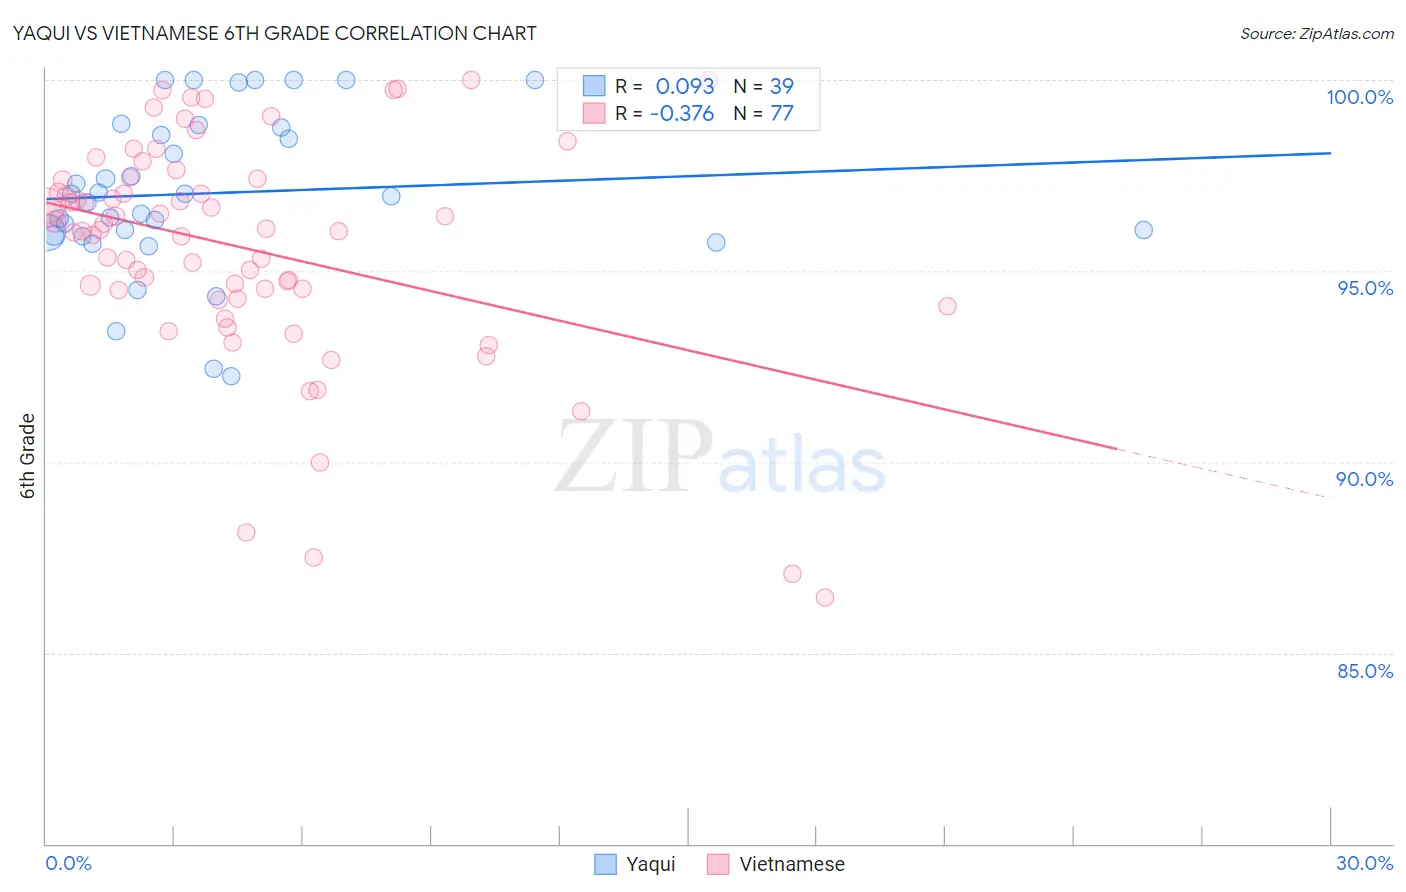
Yaqui vs Vietnamese 6th Grade Correlation Chart
The statistical analysis conducted on geographies consisting of 107,725,021 people shows a slight positive correlation between the proportion of Yaqui and percentage of population with at least 6th grade education in the United States with a correlation coefficient (R) of 0.093 and weighted average of 96.3%. Similarly, the statistical analysis conducted on geographies consisting of 170,728,240 people shows a mild negative correlation between the proportion of Vietnamese and percentage of population with at least 6th grade education in the United States with a correlation coefficient (R) of -0.376 and weighted average of 95.3%, a difference of 0.99%.
6th Grade Correlation Summary
| Measurement | Yaqui | Vietnamese |
| Minimum | 92.2% | 86.5% |
| Maximum | 100.0% | 100.0% |
| Range | 7.8% | 13.5% |
| Mean | 97.0% | 95.6% |
| Median | 96.9% | 96.1% |
| Interquartile 25% (IQ1) | 95.9% | 94.4% |
| Interquartile 75% (IQ3) | 98.8% | 97.4% |
| Interquartile Range (IQR) | 2.8% | 3.0% |
| Standard Deviation (Sample) | 2.1% | 2.9% |
| Standard Deviation (Population) | 2.0% | 2.9% |
Similar Demographics by 6th Grade
Demographics Similar to Yaqui by 6th Grade
In terms of 6th grade, the demographic groups most similar to Yaqui are Immigrants from Ghana (96.3%, a difference of 0.010%), Immigrants from Western Africa (96.3%, a difference of 0.010%), Immigrants from Thailand (96.3%, a difference of 0.010%), Immigrants from Cameroon (96.3%, a difference of 0.020%), and Immigrants from Philippines (96.3%, a difference of 0.020%).
| Demographics | Rating | Rank | 6th Grade |
| West Indians | 0.2 /100 | #269 | Tragic 96.3% |
| Immigrants | South America | 0.2 /100 | #270 | Tragic 96.3% |
| Immigrants | Hong Kong | 0.2 /100 | #271 | Tragic 96.3% |
| Immigrants | Bolivia | 0.1 /100 | #272 | Tragic 96.3% |
| Immigrants | Cameroon | 0.1 /100 | #273 | Tragic 96.3% |
| Immigrants | Philippines | 0.1 /100 | #274 | Tragic 96.3% |
| Immigrants | Ghana | 0.1 /100 | #275 | Tragic 96.3% |
| Yaqui | 0.1 /100 | #276 | Tragic 96.3% |
| Immigrants | Western Africa | 0.1 /100 | #277 | Tragic 96.3% |
| Immigrants | Thailand | 0.1 /100 | #278 | Tragic 96.3% |
| Immigrants | Peru | 0.1 /100 | #279 | Tragic 96.2% |
| Immigrants | Afghanistan | 0.1 /100 | #280 | Tragic 96.2% |
| Trinidadians and Tobagonians | 0.1 /100 | #281 | Tragic 96.2% |
| Houma | 0.1 /100 | #282 | Tragic 96.2% |
| Cubans | 0.1 /100 | #283 | Tragic 96.2% |
Demographics Similar to Vietnamese by 6th Grade
In terms of 6th grade, the demographic groups most similar to Vietnamese are Belizean (95.3%, a difference of 0.020%), Japanese (95.4%, a difference of 0.030%), Immigrants from Belize (95.3%, a difference of 0.030%), Immigrants from Bangladesh (95.4%, a difference of 0.040%), and Immigrants from Vietnam (95.4%, a difference of 0.050%).
| Demographics | Rating | Rank | 6th Grade |
| Ecuadorians | 0.0 /100 | #310 | Tragic 95.5% |
| Immigrants | Portugal | 0.0 /100 | #311 | Tragic 95.5% |
| Immigrants | Guyana | 0.0 /100 | #312 | Tragic 95.5% |
| Nicaraguans | 0.0 /100 | #313 | Tragic 95.4% |
| Immigrants | Vietnam | 0.0 /100 | #314 | Tragic 95.4% |
| Immigrants | Bangladesh | 0.0 /100 | #315 | Tragic 95.4% |
| Japanese | 0.0 /100 | #316 | Tragic 95.4% |
| Vietnamese | 0.0 /100 | #317 | Tragic 95.3% |
| Belizeans | 0.0 /100 | #318 | Tragic 95.3% |
| Immigrants | Belize | 0.0 /100 | #319 | Tragic 95.3% |
| Immigrants | Ecuador | 0.0 /100 | #320 | Tragic 95.3% |
| Immigrants | Fiji | 0.0 /100 | #321 | Tragic 95.2% |
| Immigrants | Cambodia | 0.0 /100 | #322 | Tragic 95.2% |
| Central American Indians | 0.0 /100 | #323 | Tragic 95.1% |
| Cape Verdeans | 0.0 /100 | #324 | Tragic 95.1% |