Yaqui vs Immigrants from Caribbean Family Poverty
COMPARE
Yaqui
Immigrants from Caribbean
Family Poverty
Family Poverty Comparison
Yaqui
Immigrants from Caribbean
11.3%
FAMILY POVERTY
0.0/ 100
METRIC RATING
284th/ 347
METRIC RANK
12.2%
FAMILY POVERTY
0.0/ 100
METRIC RATING
313th/ 347
METRIC RANK
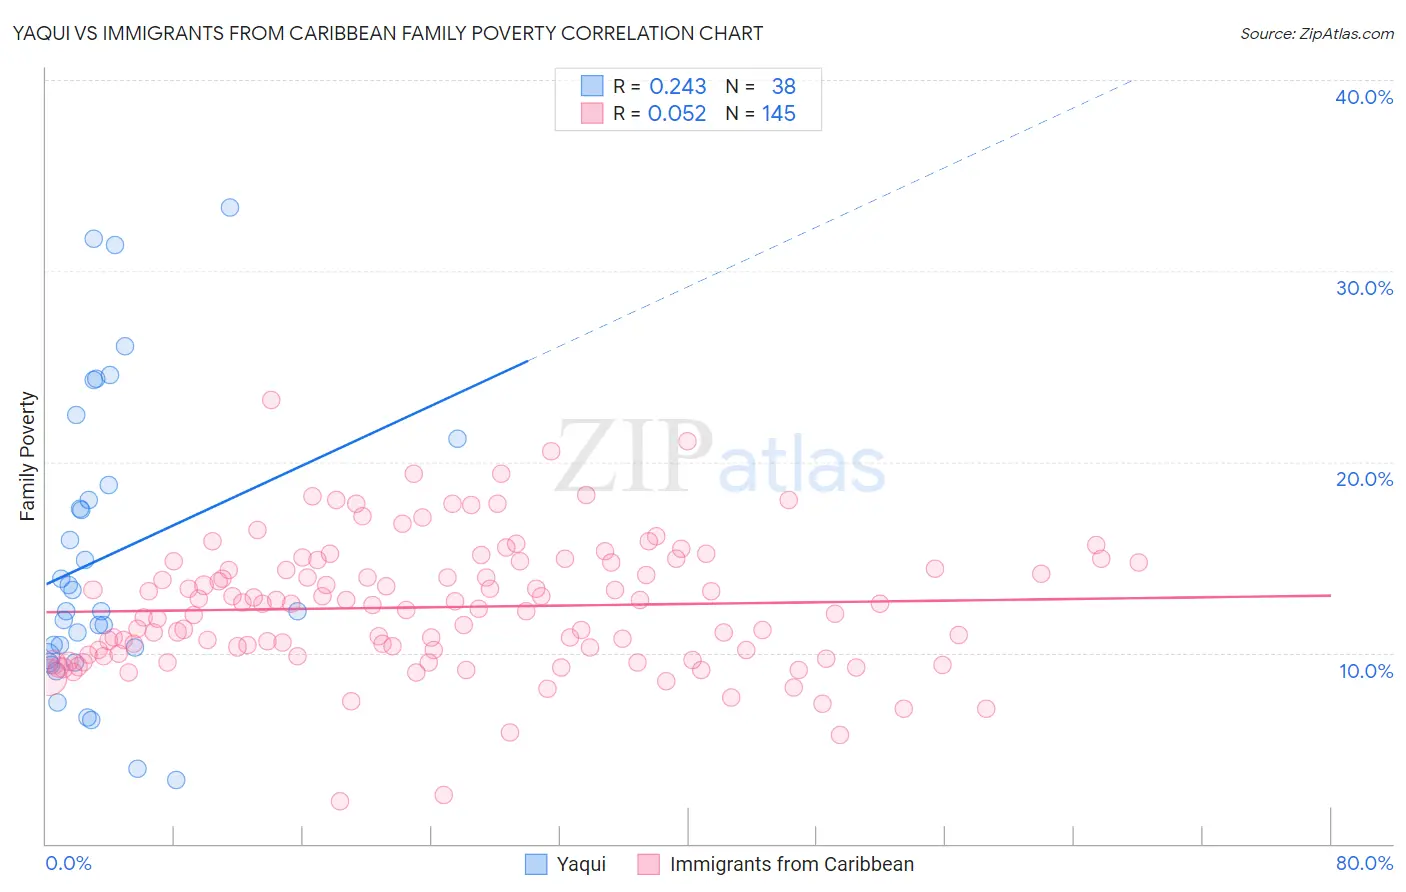
Yaqui vs Immigrants from Caribbean Family Poverty Correlation Chart
The statistical analysis conducted on geographies consisting of 107,688,240 people shows a weak positive correlation between the proportion of Yaqui and poverty level among families in the United States with a correlation coefficient (R) of 0.243 and weighted average of 11.3%. Similarly, the statistical analysis conducted on geographies consisting of 448,312,225 people shows a slight positive correlation between the proportion of Immigrants from Caribbean and poverty level among families in the United States with a correlation coefficient (R) of 0.052 and weighted average of 12.2%, a difference of 7.5%.
Family Poverty Correlation Summary
| Measurement | Yaqui | Immigrants from Caribbean |
| Minimum | 3.3% | 2.2% |
| Maximum | 33.3% | 23.2% |
| Range | 30.0% | 21.0% |
| Mean | 15.0% | 12.4% |
| Median | 12.2% | 12.5% |
| Interquartile 25% (IQ1) | 9.8% | 9.9% |
| Interquartile 75% (IQ3) | 18.8% | 14.7% |
| Interquartile Range (IQR) | 8.9% | 4.8% |
| Standard Deviation (Sample) | 7.6% | 3.4% |
| Standard Deviation (Population) | 7.5% | 3.4% |
Similar Demographics by Family Poverty
Demographics Similar to Yaqui by Family Poverty
In terms of family poverty, the demographic groups most similar to Yaqui are Barbadian (11.3%, a difference of 0.080%), Indonesian (11.3%, a difference of 0.12%), Immigrants from Cuba (11.3%, a difference of 0.16%), Immigrants from West Indies (11.3%, a difference of 0.42%), and Belizean (11.3%, a difference of 0.69%).
| Demographics | Rating | Rank | Family Poverty |
| Chippewa | 0.1 /100 | #277 | Tragic 11.2% |
| Guyanese | 0.1 /100 | #278 | Tragic 11.2% |
| Blackfeet | 0.0 /100 | #279 | Tragic 11.3% |
| Belizeans | 0.0 /100 | #280 | Tragic 11.3% |
| Immigrants | West Indies | 0.0 /100 | #281 | Tragic 11.3% |
| Immigrants | Cuba | 0.0 /100 | #282 | Tragic 11.3% |
| Indonesians | 0.0 /100 | #283 | Tragic 11.3% |
| Yaqui | 0.0 /100 | #284 | Tragic 11.3% |
| Barbadians | 0.0 /100 | #285 | Tragic 11.3% |
| Senegalese | 0.0 /100 | #286 | Tragic 11.5% |
| Vietnamese | 0.0 /100 | #287 | Tragic 11.5% |
| Immigrants | Belize | 0.0 /100 | #288 | Tragic 11.5% |
| Immigrants | Barbados | 0.0 /100 | #289 | Tragic 11.5% |
| West Indians | 0.0 /100 | #290 | Tragic 11.5% |
| Haitians | 0.0 /100 | #291 | Tragic 11.5% |
Demographics Similar to Immigrants from Caribbean by Family Poverty
In terms of family poverty, the demographic groups most similar to Immigrants from Caribbean are Kiowa (12.2%, a difference of 0.50%), Immigrants from Central America (12.1%, a difference of 0.68%), Immigrants from Mexico (12.3%, a difference of 0.76%), Ute (12.1%, a difference of 1.1%), and Honduran (12.4%, a difference of 1.5%).
| Demographics | Rating | Rank | Family Poverty |
| Cajuns | 0.0 /100 | #306 | Tragic 11.9% |
| Immigrants | Congo | 0.0 /100 | #307 | Tragic 11.9% |
| Seminole | 0.0 /100 | #308 | Tragic 11.9% |
| Hispanics or Latinos | 0.0 /100 | #309 | Tragic 12.0% |
| Immigrants | Guatemala | 0.0 /100 | #310 | Tragic 12.0% |
| Ute | 0.0 /100 | #311 | Tragic 12.1% |
| Immigrants | Central America | 0.0 /100 | #312 | Tragic 12.1% |
| Immigrants | Caribbean | 0.0 /100 | #313 | Tragic 12.2% |
| Kiowa | 0.0 /100 | #314 | Tragic 12.2% |
| Immigrants | Mexico | 0.0 /100 | #315 | Tragic 12.3% |
| Hondurans | 0.0 /100 | #316 | Tragic 12.4% |
| Immigrants | Grenada | 0.0 /100 | #317 | Tragic 12.4% |
| U.S. Virgin Islanders | 0.0 /100 | #318 | Tragic 12.4% |
| British West Indians | 0.0 /100 | #319 | Tragic 12.4% |
| Inupiat | 0.0 /100 | #320 | Tragic 12.5% |