Immigrants from Grenada vs Immigrants from Caribbean Disability
COMPARE
Immigrants from Grenada
Immigrants from Caribbean
Disability
Disability Comparison
Immigrants from Grenada
Immigrants from Caribbean
11.5%
DISABILITY
86.1/ 100
METRIC RATING
141st/ 347
METRIC RANK
12.0%
DISABILITY
9.1/ 100
METRIC RATING
208th/ 347
METRIC RANK
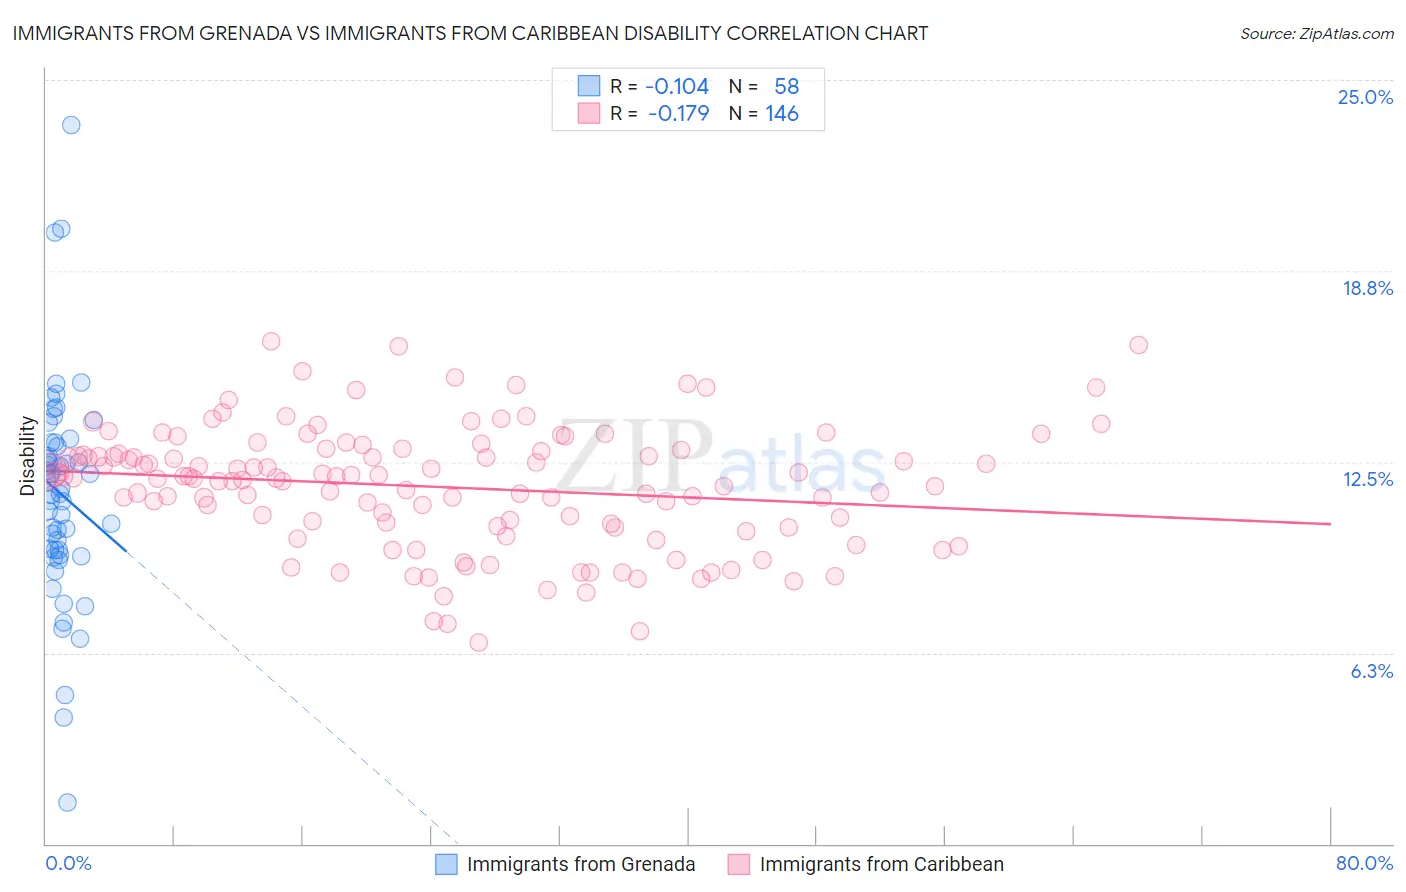
Immigrants from Grenada vs Immigrants from Caribbean Disability Correlation Chart
The statistical analysis conducted on geographies consisting of 67,198,924 people shows a poor negative correlation between the proportion of Immigrants from Grenada and percentage of population with a disability in the United States with a correlation coefficient (R) of -0.104 and weighted average of 11.5%. Similarly, the statistical analysis conducted on geographies consisting of 449,955,914 people shows a poor negative correlation between the proportion of Immigrants from Caribbean and percentage of population with a disability in the United States with a correlation coefficient (R) of -0.179 and weighted average of 12.0%, a difference of 4.7%.
Disability Correlation Summary
| Measurement | Immigrants from Grenada | Immigrants from Caribbean |
| Minimum | 1.4% | 6.6% |
| Maximum | 23.5% | 16.5% |
| Range | 22.2% | 9.9% |
| Mean | 11.5% | 11.7% |
| Median | 11.5% | 12.0% |
| Interquartile 25% (IQ1) | 9.6% | 10.4% |
| Interquartile 75% (IQ3) | 13.1% | 12.8% |
| Interquartile Range (IQR) | 3.5% | 2.5% |
| Standard Deviation (Sample) | 3.6% | 2.0% |
| Standard Deviation (Population) | 3.6% | 2.0% |
Similar Demographics by Disability
Demographics Similar to Immigrants from Grenada by Disability
In terms of disability, the demographic groups most similar to Immigrants from Grenada are Russian (11.5%, a difference of 0.070%), Immigrants from Sudan (11.5%, a difference of 0.070%), Ghanaian (11.5%, a difference of 0.080%), New Zealander (11.5%, a difference of 0.090%), and Kenyan (11.5%, a difference of 0.10%).
| Demographics | Rating | Rank | Disability |
| Immigrants | Guyana | 88.3 /100 | #134 | Excellent 11.4% |
| Ugandans | 87.9 /100 | #135 | Excellent 11.4% |
| Immigrants | St. Vincent and the Grenadines | 87.8 /100 | #136 | Excellent 11.4% |
| Kenyans | 87.1 /100 | #137 | Excellent 11.5% |
| New Zealanders | 87.0 /100 | #138 | Excellent 11.5% |
| Ghanaians | 87.0 /100 | #139 | Excellent 11.5% |
| Russians | 86.8 /100 | #140 | Excellent 11.5% |
| Immigrants | Grenada | 86.1 /100 | #141 | Excellent 11.5% |
| Immigrants | Sudan | 85.3 /100 | #142 | Excellent 11.5% |
| Moroccans | 83.3 /100 | #143 | Excellent 11.5% |
| Australians | 82.5 /100 | #144 | Excellent 11.5% |
| Nigerians | 81.3 /100 | #145 | Excellent 11.5% |
| Immigrants | Hungary | 79.0 /100 | #146 | Good 11.5% |
| Immigrants | Ukraine | 77.6 /100 | #147 | Good 11.5% |
| Sudanese | 77.1 /100 | #148 | Good 11.5% |
Demographics Similar to Immigrants from Caribbean by Disability
In terms of disability, the demographic groups most similar to Immigrants from Caribbean are Immigrants from Thailand (12.0%, a difference of 0.020%), Immigrants from Senegal (12.0%, a difference of 0.040%), Danish (12.0%, a difference of 0.050%), Immigrants from Western Europe (12.0%, a difference of 0.12%), and Czech (12.0%, a difference of 0.17%).
| Demographics | Rating | Rank | Disability |
| Assyrians/Chaldeans/Syriacs | 12.6 /100 | #201 | Poor 11.9% |
| Immigrants | England | 12.0 /100 | #202 | Poor 12.0% |
| British West Indians | 11.5 /100 | #203 | Poor 12.0% |
| Mexican American Indians | 11.4 /100 | #204 | Poor 12.0% |
| Immigrants | Western Europe | 10.1 /100 | #205 | Poor 12.0% |
| Immigrants | Senegal | 9.4 /100 | #206 | Tragic 12.0% |
| Immigrants | Thailand | 9.3 /100 | #207 | Tragic 12.0% |
| Immigrants | Caribbean | 9.1 /100 | #208 | Tragic 12.0% |
| Danes | 8.7 /100 | #209 | Tragic 12.0% |
| Czechs | 7.9 /100 | #210 | Tragic 12.0% |
| Immigrants | Cambodia | 7.3 /100 | #211 | Tragic 12.0% |
| Austrians | 7.2 /100 | #212 | Tragic 12.0% |
| Immigrants | Iraq | 7.1 /100 | #213 | Tragic 12.0% |
| Immigrants | Somalia | 6.8 /100 | #214 | Tragic 12.0% |
| Immigrants | Canada | 6.1 /100 | #215 | Tragic 12.1% |