Immigrants from Burma/Myanmar vs Salvadoran Disability Age 18 to 34
COMPARE
Immigrants from Burma/Myanmar
Salvadoran
Disability Age 18 to 34
Disability Age 18 to 34 Comparison
Immigrants from Burma/Myanmar
Salvadorans
6.8%
DISABILITY AGE 18 TO 34
12.3/ 100
METRIC RATING
209th/ 347
METRIC RANK
6.0%
DISABILITY AGE 18 TO 34
99.6/ 100
METRIC RATING
63rd/ 347
METRIC RANK
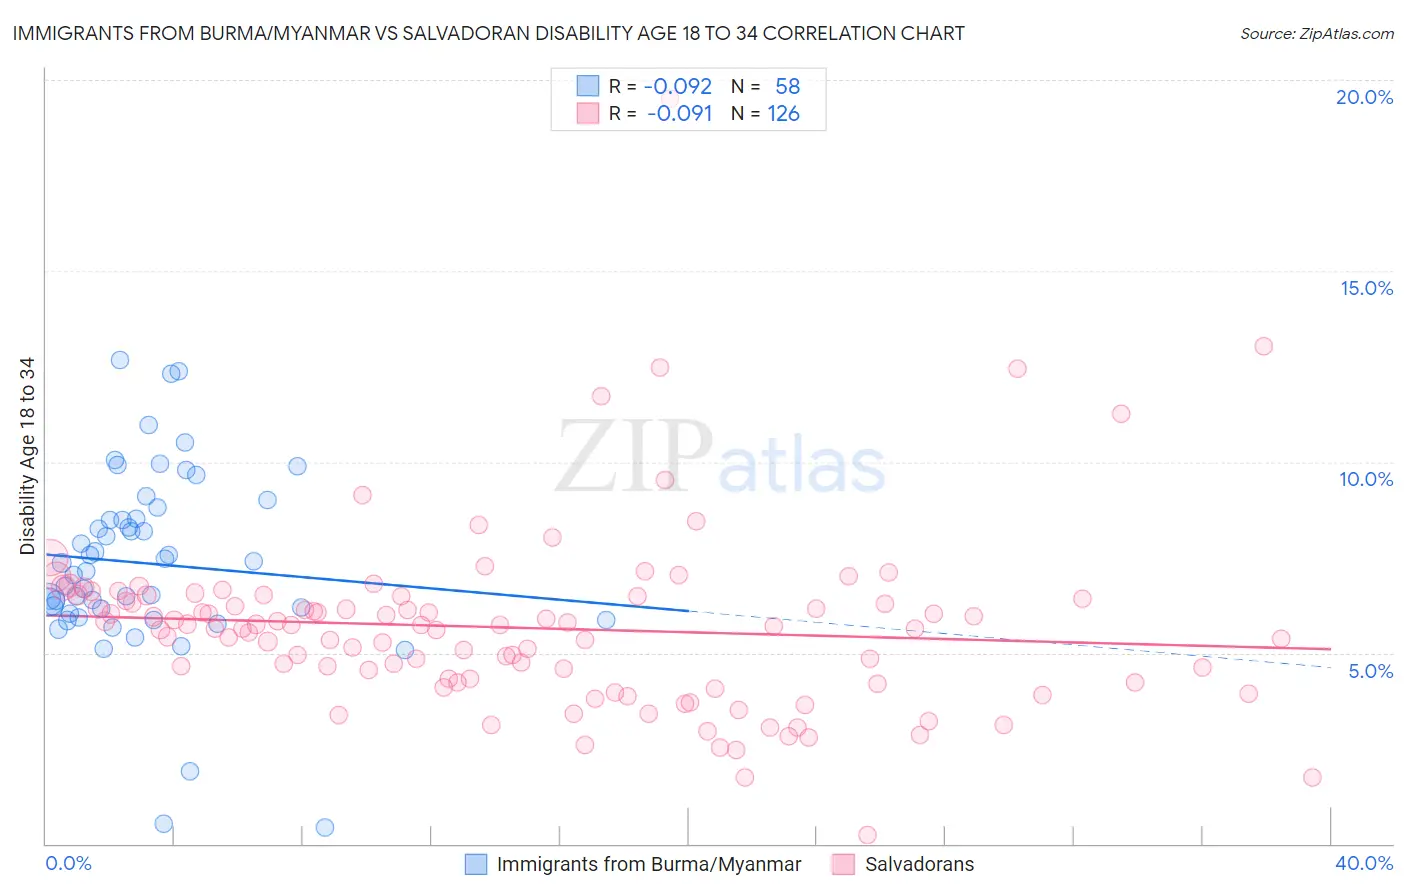
Immigrants from Burma/Myanmar vs Salvadoran Disability Age 18 to 34 Correlation Chart
The statistical analysis conducted on geographies consisting of 172,278,833 people shows a slight negative correlation between the proportion of Immigrants from Burma/Myanmar and percentage of population with a disability between the ages 18 and 35 in the United States with a correlation coefficient (R) of -0.092 and weighted average of 6.8%. Similarly, the statistical analysis conducted on geographies consisting of 398,205,845 people shows a slight negative correlation between the proportion of Salvadorans and percentage of population with a disability between the ages 18 and 35 in the United States with a correlation coefficient (R) of -0.091 and weighted average of 6.0%, a difference of 14.2%.
Disability Age 18 to 34 Correlation Summary
| Measurement | Immigrants from Burma/Myanmar | Salvadoran |
| Minimum | 0.44% | 0.22% |
| Maximum | 12.7% | 19.5% |
| Range | 12.2% | 19.3% |
| Mean | 7.3% | 5.7% |
| Median | 7.2% | 5.7% |
| Interquartile 25% (IQ1) | 6.0% | 4.2% |
| Interquartile 75% (IQ3) | 8.5% | 6.5% |
| Interquartile Range (IQR) | 2.5% | 2.2% |
| Standard Deviation (Sample) | 2.4% | 2.4% |
| Standard Deviation (Population) | 2.4% | 2.4% |
Similar Demographics by Disability Age 18 to 34
Demographics Similar to Immigrants from Burma/Myanmar by Disability Age 18 to 34
In terms of disability age 18 to 34, the demographic groups most similar to Immigrants from Burma/Myanmar are Immigrants from Scotland (6.8%, a difference of 0.020%), Mexican (6.8%, a difference of 0.040%), Japanese (6.8%, a difference of 0.080%), Lebanese (6.8%, a difference of 0.15%), and Immigrants from Bosnia and Herzegovina (6.8%, a difference of 0.20%).
| Demographics | Rating | Rank | Disability Age 18 to 34 |
| Panamanians | 15.8 /100 | #202 | Poor 6.8% |
| Hispanics or Latinos | 13.8 /100 | #203 | Poor 6.8% |
| Immigrants | Bosnia and Herzegovina | 13.6 /100 | #204 | Poor 6.8% |
| Lebanese | 13.3 /100 | #205 | Poor 6.8% |
| Japanese | 12.8 /100 | #206 | Poor 6.8% |
| Mexicans | 12.6 /100 | #207 | Poor 6.8% |
| Immigrants | Scotland | 12.4 /100 | #208 | Poor 6.8% |
| Immigrants | Burma/Myanmar | 12.3 /100 | #209 | Poor 6.8% |
| Latvians | 11.1 /100 | #210 | Poor 6.8% |
| Immigrants | Norway | 10.0 /100 | #211 | Tragic 6.8% |
| Luxembourgers | 9.4 /100 | #212 | Tragic 6.9% |
| Immigrants | Western Europe | 9.1 /100 | #213 | Tragic 6.9% |
| Serbians | 8.2 /100 | #214 | Tragic 6.9% |
| Immigrants | Thailand | 7.5 /100 | #215 | Tragic 6.9% |
| Sudanese | 7.0 /100 | #216 | Tragic 6.9% |
Demographics Similar to Salvadorans by Disability Age 18 to 34
In terms of disability age 18 to 34, the demographic groups most similar to Salvadorans are Taiwanese (6.0%, a difference of 0.010%), Peruvian (6.0%, a difference of 0.050%), British West Indian (6.0%, a difference of 0.080%), Trinidadian and Tobagonian (6.0%, a difference of 0.15%), and Burmese (6.0%, a difference of 0.29%).
| Demographics | Rating | Rank | Disability Age 18 to 34 |
| Paraguayans | 99.7 /100 | #56 | Exceptional 5.9% |
| Immigrants | Haiti | 99.7 /100 | #57 | Exceptional 5.9% |
| Immigrants | Serbia | 99.7 /100 | #58 | Exceptional 5.9% |
| Immigrants | Caribbean | 99.6 /100 | #59 | Exceptional 6.0% |
| Immigrants | Sri Lanka | 99.6 /100 | #60 | Exceptional 6.0% |
| British West Indians | 99.6 /100 | #61 | Exceptional 6.0% |
| Peruvians | 99.6 /100 | #62 | Exceptional 6.0% |
| Salvadorans | 99.6 /100 | #63 | Exceptional 6.0% |
| Taiwanese | 99.6 /100 | #64 | Exceptional 6.0% |
| Trinidadians and Tobagonians | 99.5 /100 | #65 | Exceptional 6.0% |
| Burmese | 99.5 /100 | #66 | Exceptional 6.0% |
| Immigrants | North Macedonia | 99.5 /100 | #67 | Exceptional 6.0% |
| Immigrants | Poland | 99.5 /100 | #68 | Exceptional 6.0% |
| Immigrants | West Indies | 99.4 /100 | #69 | Exceptional 6.0% |
| Immigrants | Greece | 99.4 /100 | #70 | Exceptional 6.0% |