Immigrants from West Indies vs Immigrants from Sweden Disability Age Over 75
COMPARE
Immigrants from West Indies
Immigrants from Sweden
Disability Age Over 75
Disability Age Over 75 Comparison
Immigrants from West Indies
Immigrants from Sweden
48.9%
DISABILITY AGE OVER 75
0.3/ 100
METRIC RATING
262nd/ 347
METRIC RANK
45.1%
DISABILITY AGE OVER 75
100.0/ 100
METRIC RATING
15th/ 347
METRIC RANK
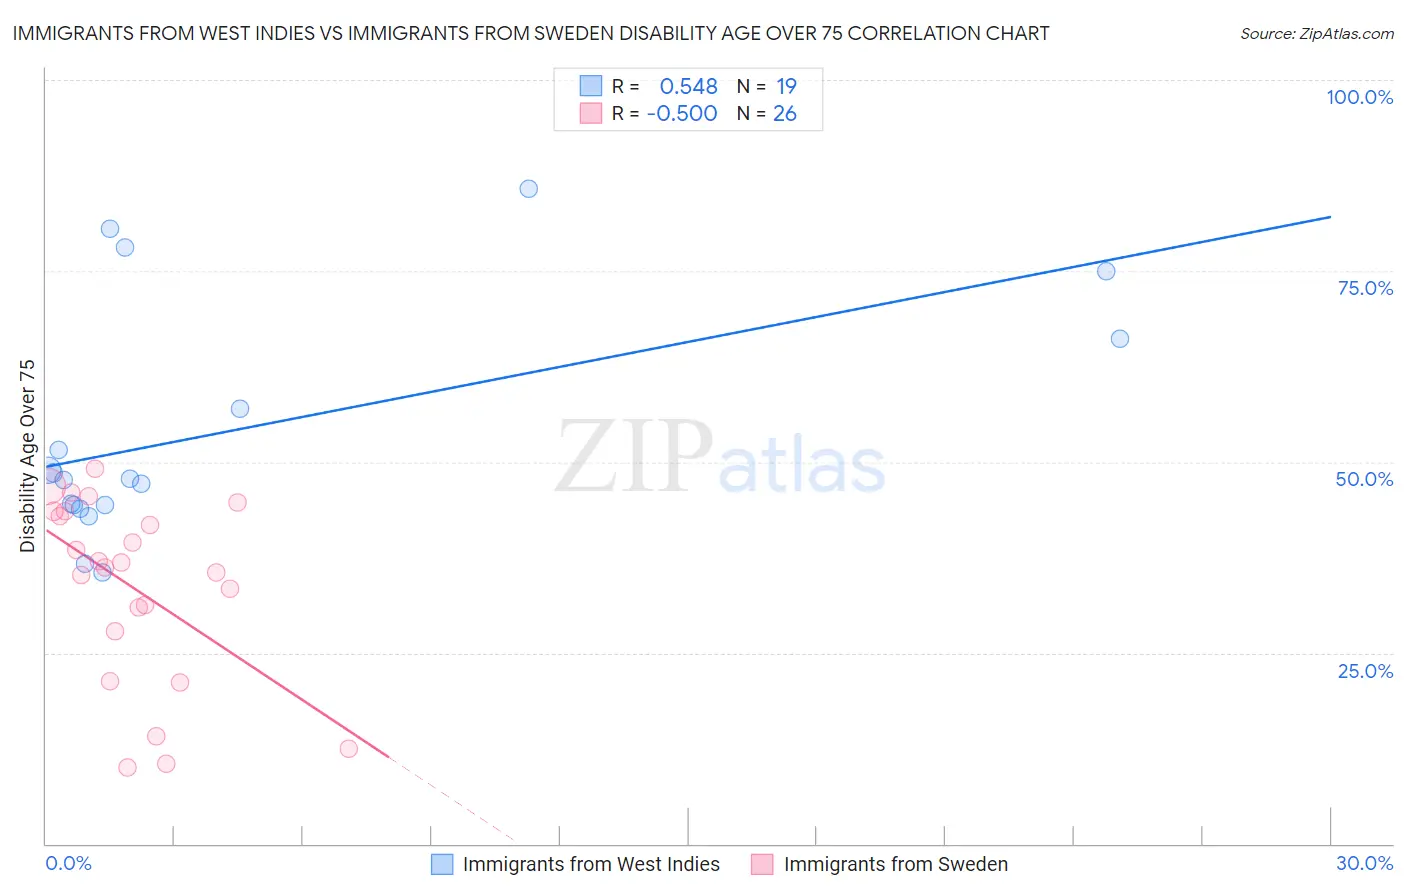
Immigrants from West Indies vs Immigrants from Sweden Disability Age Over 75 Correlation Chart
The statistical analysis conducted on geographies consisting of 72,454,628 people shows a substantial positive correlation between the proportion of Immigrants from West Indies and percentage of population with a disability over the age of 75 in the United States with a correlation coefficient (R) of 0.548 and weighted average of 48.9%. Similarly, the statistical analysis conducted on geographies consisting of 164,657,038 people shows a moderate negative correlation between the proportion of Immigrants from Sweden and percentage of population with a disability over the age of 75 in the United States with a correlation coefficient (R) of -0.500 and weighted average of 45.1%, a difference of 8.3%.
Disability Age Over 75 Correlation Summary
| Measurement | Immigrants from West Indies | Immigrants from Sweden |
| Minimum | 35.5% | 10.0% |
| Maximum | 85.7% | 49.2% |
| Range | 50.2% | 39.2% |
| Mean | 54.0% | 33.7% |
| Median | 47.7% | 36.5% |
| Interquartile 25% (IQ1) | 44.3% | 27.9% |
| Interquartile 75% (IQ3) | 66.2% | 43.5% |
| Interquartile Range (IQR) | 21.9% | 15.7% |
| Standard Deviation (Sample) | 15.3% | 11.9% |
| Standard Deviation (Population) | 14.9% | 11.7% |
Similar Demographics by Disability Age Over 75
Demographics Similar to Immigrants from West Indies by Disability Age Over 75
In terms of disability age over 75, the demographic groups most similar to Immigrants from West Indies are Salvadoran (48.9%, a difference of 0.020%), African (48.9%, a difference of 0.060%), Immigrants from Honduras (48.9%, a difference of 0.070%), Honduran (48.9%, a difference of 0.080%), and U.S. Virgin Islander (48.9%, a difference of 0.11%).
| Demographics | Rating | Rank | Disability Age Over 75 |
| Chinese | 0.5 /100 | #255 | Tragic 48.7% |
| Immigrants | Congo | 0.5 /100 | #256 | Tragic 48.7% |
| Blackfeet | 0.5 /100 | #257 | Tragic 48.8% |
| Immigrants | Philippines | 0.4 /100 | #258 | Tragic 48.8% |
| Central Americans | 0.4 /100 | #259 | Tragic 48.8% |
| Immigrants | Afghanistan | 0.4 /100 | #260 | Tragic 48.8% |
| Africans | 0.3 /100 | #261 | Tragic 48.9% |
| Immigrants | West Indies | 0.3 /100 | #262 | Tragic 48.9% |
| Salvadorans | 0.3 /100 | #263 | Tragic 48.9% |
| Immigrants | Honduras | 0.3 /100 | #264 | Tragic 48.9% |
| Hondurans | 0.3 /100 | #265 | Tragic 48.9% |
| U.S. Virgin Islanders | 0.2 /100 | #266 | Tragic 48.9% |
| Malaysians | 0.2 /100 | #267 | Tragic 49.0% |
| Guatemalans | 0.2 /100 | #268 | Tragic 49.0% |
| Immigrants | El Salvador | 0.2 /100 | #269 | Tragic 49.0% |
Demographics Similar to Immigrants from Sweden by Disability Age Over 75
In terms of disability age over 75, the demographic groups most similar to Immigrants from Sweden are Immigrants from Scotland (45.1%, a difference of 0.040%), Latvian (45.1%, a difference of 0.050%), Immigrants from Czechoslovakia (45.1%, a difference of 0.060%), Immigrants from Northern Europe (45.2%, a difference of 0.090%), and Immigrants from India (45.2%, a difference of 0.10%).
| Demographics | Rating | Rank | Disability Age Over 75 |
| Immigrants | Austria | 100.0 /100 | #8 | Exceptional 44.9% |
| Paraguayans | 100.0 /100 | #9 | Exceptional 45.0% |
| Bulgarians | 100.0 /100 | #10 | Exceptional 45.1% |
| Lithuanians | 100.0 /100 | #11 | Exceptional 45.1% |
| Immigrants | Czechoslovakia | 100.0 /100 | #12 | Exceptional 45.1% |
| Latvians | 100.0 /100 | #13 | Exceptional 45.1% |
| Immigrants | Scotland | 100.0 /100 | #14 | Exceptional 45.1% |
| Immigrants | Sweden | 100.0 /100 | #15 | Exceptional 45.1% |
| Immigrants | Northern Europe | 100.0 /100 | #16 | Exceptional 45.2% |
| Immigrants | India | 100.0 /100 | #17 | Exceptional 45.2% |
| Bolivians | 100.0 /100 | #18 | Exceptional 45.2% |
| Immigrants | Greece | 100.0 /100 | #19 | Exceptional 45.2% |
| Immigrants | Serbia | 100.0 /100 | #20 | Exceptional 45.3% |
| Immigrants | Belgium | 100.0 /100 | #21 | Exceptional 45.3% |
| Immigrants | South Africa | 100.0 /100 | #22 | Exceptional 45.3% |