Italian vs Immigrants from Poland Ambulatory Disability
COMPARE
Italian
Immigrants from Poland
Ambulatory Disability
Ambulatory Disability Comparison
Italians
Immigrants from Poland
6.2%
AMBULATORY DISABILITY
22.6/ 100
METRIC RATING
199th/ 347
METRIC RANK
5.9%
AMBULATORY DISABILITY
95.4/ 100
METRIC RATING
114th/ 347
METRIC RANK
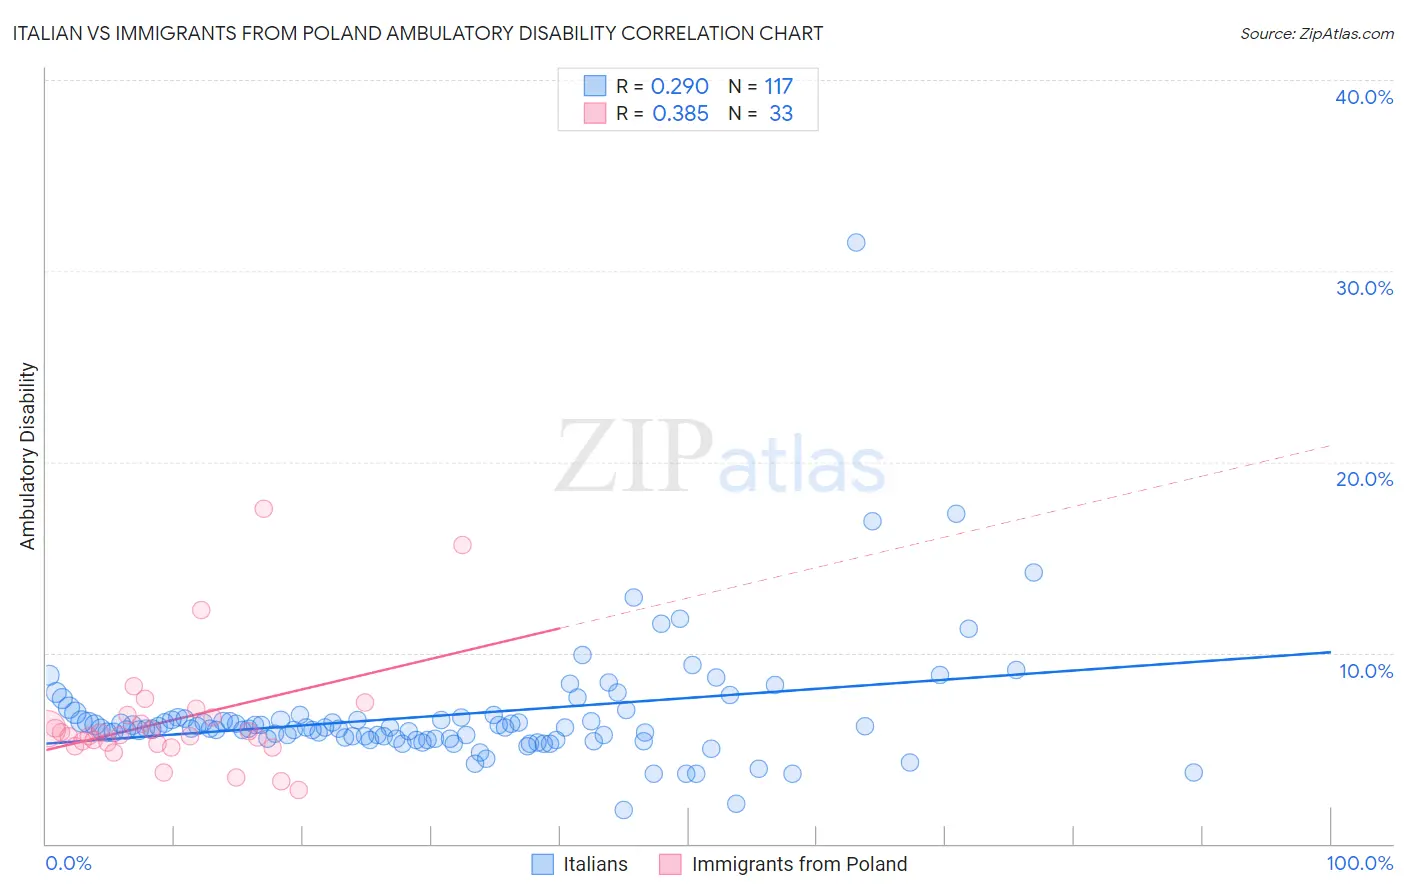
Italian vs Immigrants from Poland Ambulatory Disability Correlation Chart
The statistical analysis conducted on geographies consisting of 574,457,060 people shows a weak positive correlation between the proportion of Italians and percentage of population with ambulatory disability in the United States with a correlation coefficient (R) of 0.290 and weighted average of 6.2%. Similarly, the statistical analysis conducted on geographies consisting of 304,808,570 people shows a mild positive correlation between the proportion of Immigrants from Poland and percentage of population with ambulatory disability in the United States with a correlation coefficient (R) of 0.385 and weighted average of 5.9%, a difference of 5.9%.
Ambulatory Disability Correlation Summary
| Measurement | Italian | Immigrants from Poland |
| Minimum | 1.8% | 2.8% |
| Maximum | 31.5% | 17.5% |
| Range | 29.8% | 14.7% |
| Mean | 6.7% | 6.5% |
| Median | 6.1% | 5.7% |
| Interquartile 25% (IQ1) | 5.5% | 5.2% |
| Interquartile 75% (IQ3) | 6.6% | 6.7% |
| Interquartile Range (IQR) | 1.1% | 1.5% |
| Standard Deviation (Sample) | 3.3% | 3.1% |
| Standard Deviation (Population) | 3.2% | 3.0% |
Similar Demographics by Ambulatory Disability
Demographics Similar to Italians by Ambulatory Disability
In terms of ambulatory disability, the demographic groups most similar to Italians are Immigrants from Cambodia (6.2%, a difference of 0.080%), Immigrants from Bangladesh (6.2%, a difference of 0.14%), Immigrants from Central America (6.2%, a difference of 0.20%), Albanian (6.2%, a difference of 0.22%), and Polish (6.2%, a difference of 0.26%).
| Demographics | Rating | Rank | Ambulatory Disability |
| Immigrants | Western Europe | 31.6 /100 | #192 | Fair 6.2% |
| Guatemalans | 30.0 /100 | #193 | Fair 6.2% |
| Alaska Natives | 29.8 /100 | #194 | Fair 6.2% |
| Belgians | 28.6 /100 | #195 | Fair 6.2% |
| Malaysians | 28.2 /100 | #196 | Fair 6.2% |
| Poles | 26.3 /100 | #197 | Fair 6.2% |
| Immigrants | Bangladesh | 24.6 /100 | #198 | Fair 6.2% |
| Italians | 22.6 /100 | #199 | Fair 6.2% |
| Immigrants | Cambodia | 21.5 /100 | #200 | Fair 6.2% |
| Immigrants | Central America | 20.1 /100 | #201 | Fair 6.2% |
| Albanians | 19.7 /100 | #202 | Poor 6.2% |
| Immigrants | Ukraine | 18.4 /100 | #203 | Poor 6.2% |
| Immigrants | Congo | 18.2 /100 | #204 | Poor 6.2% |
| Slovenes | 18.0 /100 | #205 | Poor 6.2% |
| Finns | 17.2 /100 | #206 | Poor 6.2% |
Demographics Similar to Immigrants from Poland by Ambulatory Disability
In terms of ambulatory disability, the demographic groups most similar to Immigrants from Poland are Immigrants from Uruguay (5.9%, a difference of 0.060%), South American Indian (5.9%, a difference of 0.21%), Immigrants from Africa (5.9%, a difference of 0.22%), South African (5.9%, a difference of 0.28%), and Danish (5.8%, a difference of 0.41%).
| Demographics | Rating | Rank | Ambulatory Disability |
| Uruguayans | 97.2 /100 | #107 | Exceptional 5.8% |
| Colombians | 97.2 /100 | #108 | Exceptional 5.8% |
| Immigrants | Netherlands | 97.1 /100 | #109 | Exceptional 5.8% |
| Immigrants | Colombia | 96.7 /100 | #110 | Exceptional 5.8% |
| Danes | 96.6 /100 | #111 | Exceptional 5.8% |
| South Africans | 96.3 /100 | #112 | Exceptional 5.9% |
| Immigrants | Uruguay | 95.6 /100 | #113 | Exceptional 5.9% |
| Immigrants | Poland | 95.4 /100 | #114 | Exceptional 5.9% |
| South American Indians | 94.8 /100 | #115 | Exceptional 5.9% |
| Immigrants | Africa | 94.7 /100 | #116 | Exceptional 5.9% |
| Immigrants | South Eastern Asia | 93.6 /100 | #117 | Exceptional 5.9% |
| Russians | 93.4 /100 | #118 | Exceptional 5.9% |
| Norwegians | 93.1 /100 | #119 | Exceptional 5.9% |
| Estonians | 92.9 /100 | #120 | Exceptional 5.9% |
| Costa Ricans | 92.6 /100 | #121 | Exceptional 5.9% |