Irish vs Immigrants from Poland Ambulatory Disability
COMPARE
Irish
Immigrants from Poland
Ambulatory Disability
Ambulatory Disability Comparison
Irish
Immigrants from Poland
6.6%
AMBULATORY DISABILITY
0.4/ 100
METRIC RATING
261st/ 347
METRIC RANK
5.9%
AMBULATORY DISABILITY
95.4/ 100
METRIC RATING
114th/ 347
METRIC RANK
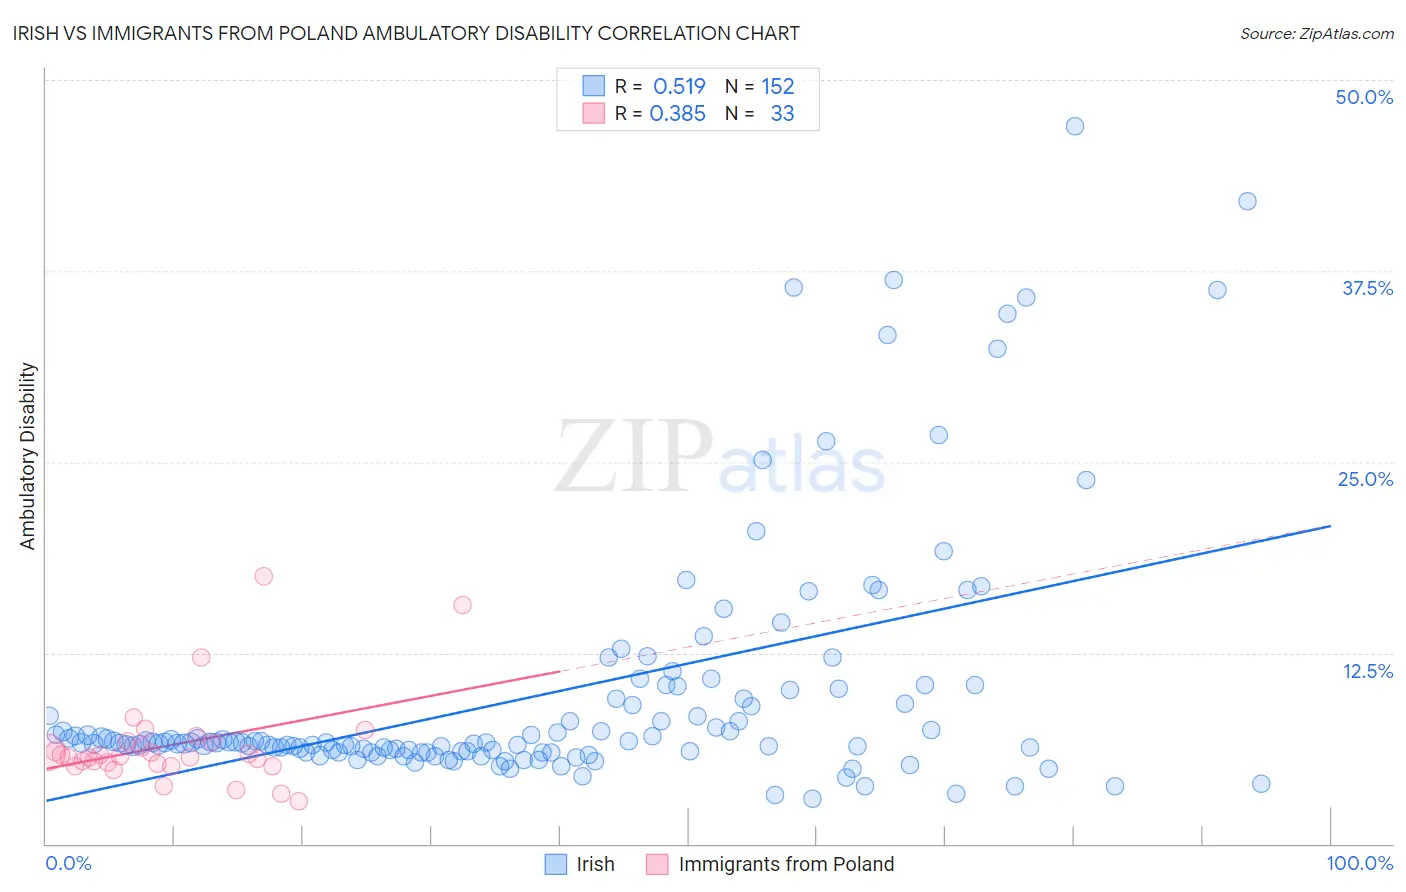
Irish vs Immigrants from Poland Ambulatory Disability Correlation Chart
The statistical analysis conducted on geographies consisting of 579,881,456 people shows a substantial positive correlation between the proportion of Irish and percentage of population with ambulatory disability in the United States with a correlation coefficient (R) of 0.519 and weighted average of 6.6%. Similarly, the statistical analysis conducted on geographies consisting of 304,808,570 people shows a mild positive correlation between the proportion of Immigrants from Poland and percentage of population with ambulatory disability in the United States with a correlation coefficient (R) of 0.385 and weighted average of 5.9%, a difference of 11.8%.
Ambulatory Disability Correlation Summary
| Measurement | Irish | Immigrants from Poland |
| Minimum | 3.0% | 2.8% |
| Maximum | 47.0% | 17.5% |
| Range | 44.0% | 14.7% |
| Mean | 9.8% | 6.5% |
| Median | 6.6% | 5.7% |
| Interquartile 25% (IQ1) | 6.1% | 5.2% |
| Interquartile 75% (IQ3) | 9.5% | 6.7% |
| Interquartile Range (IQR) | 3.4% | 1.5% |
| Standard Deviation (Sample) | 8.2% | 3.1% |
| Standard Deviation (Population) | 8.1% | 3.0% |
Similar Demographics by Ambulatory Disability
Demographics Similar to Irish by Ambulatory Disability
In terms of ambulatory disability, the demographic groups most similar to Irish are Immigrants from Belize (6.6%, a difference of 0.070%), Aleut (6.6%, a difference of 0.080%), English (6.6%, a difference of 0.17%), Spanish American Indian (6.5%, a difference of 0.26%), and Hmong (6.6%, a difference of 0.29%).
| Demographics | Rating | Rank | Ambulatory Disability |
| Belizeans | 0.7 /100 | #254 | Tragic 6.5% |
| Welsh | 0.6 /100 | #255 | Tragic 6.5% |
| Immigrants | Uzbekistan | 0.6 /100 | #256 | Tragic 6.5% |
| Bermudans | 0.5 /100 | #257 | Tragic 6.5% |
| Spanish American Indians | 0.5 /100 | #258 | Tragic 6.5% |
| Aleuts | 0.4 /100 | #259 | Tragic 6.6% |
| Immigrants | Belize | 0.4 /100 | #260 | Tragic 6.6% |
| Irish | 0.4 /100 | #261 | Tragic 6.6% |
| English | 0.4 /100 | #262 | Tragic 6.6% |
| Hmong | 0.3 /100 | #263 | Tragic 6.6% |
| Nepalese | 0.2 /100 | #264 | Tragic 6.6% |
| Bahamians | 0.2 /100 | #265 | Tragic 6.6% |
| Guyanese | 0.2 /100 | #266 | Tragic 6.6% |
| Trinidadians and Tobagonians | 0.2 /100 | #267 | Tragic 6.6% |
| Spanish | 0.2 /100 | #268 | Tragic 6.6% |
Demographics Similar to Immigrants from Poland by Ambulatory Disability
In terms of ambulatory disability, the demographic groups most similar to Immigrants from Poland are Immigrants from Uruguay (5.9%, a difference of 0.060%), South American Indian (5.9%, a difference of 0.21%), Immigrants from Africa (5.9%, a difference of 0.22%), South African (5.9%, a difference of 0.28%), and Danish (5.8%, a difference of 0.41%).
| Demographics | Rating | Rank | Ambulatory Disability |
| Uruguayans | 97.2 /100 | #107 | Exceptional 5.8% |
| Colombians | 97.2 /100 | #108 | Exceptional 5.8% |
| Immigrants | Netherlands | 97.1 /100 | #109 | Exceptional 5.8% |
| Immigrants | Colombia | 96.7 /100 | #110 | Exceptional 5.8% |
| Danes | 96.6 /100 | #111 | Exceptional 5.8% |
| South Africans | 96.3 /100 | #112 | Exceptional 5.9% |
| Immigrants | Uruguay | 95.6 /100 | #113 | Exceptional 5.9% |
| Immigrants | Poland | 95.4 /100 | #114 | Exceptional 5.9% |
| South American Indians | 94.8 /100 | #115 | Exceptional 5.9% |
| Immigrants | Africa | 94.7 /100 | #116 | Exceptional 5.9% |
| Immigrants | South Eastern Asia | 93.6 /100 | #117 | Exceptional 5.9% |
| Russians | 93.4 /100 | #118 | Exceptional 5.9% |
| Norwegians | 93.1 /100 | #119 | Exceptional 5.9% |
| Estonians | 92.9 /100 | #120 | Exceptional 5.9% |
| Costa Ricans | 92.6 /100 | #121 | Exceptional 5.9% |