White/Caucasian vs French Canadian Disability Age 5 to 17
COMPARE
White/Caucasian
French Canadian
Disability Age 5 to 17
Disability Age 5 to 17 Comparison
Whites/Caucasians
French Canadians
6.2%
DISABILITY AGE 5 TO 17
0.0/ 100
METRIC RATING
291st/ 347
METRIC RANK
6.7%
DISABILITY AGE 5 TO 17
0.0/ 100
METRIC RATING
331st/ 347
METRIC RANK
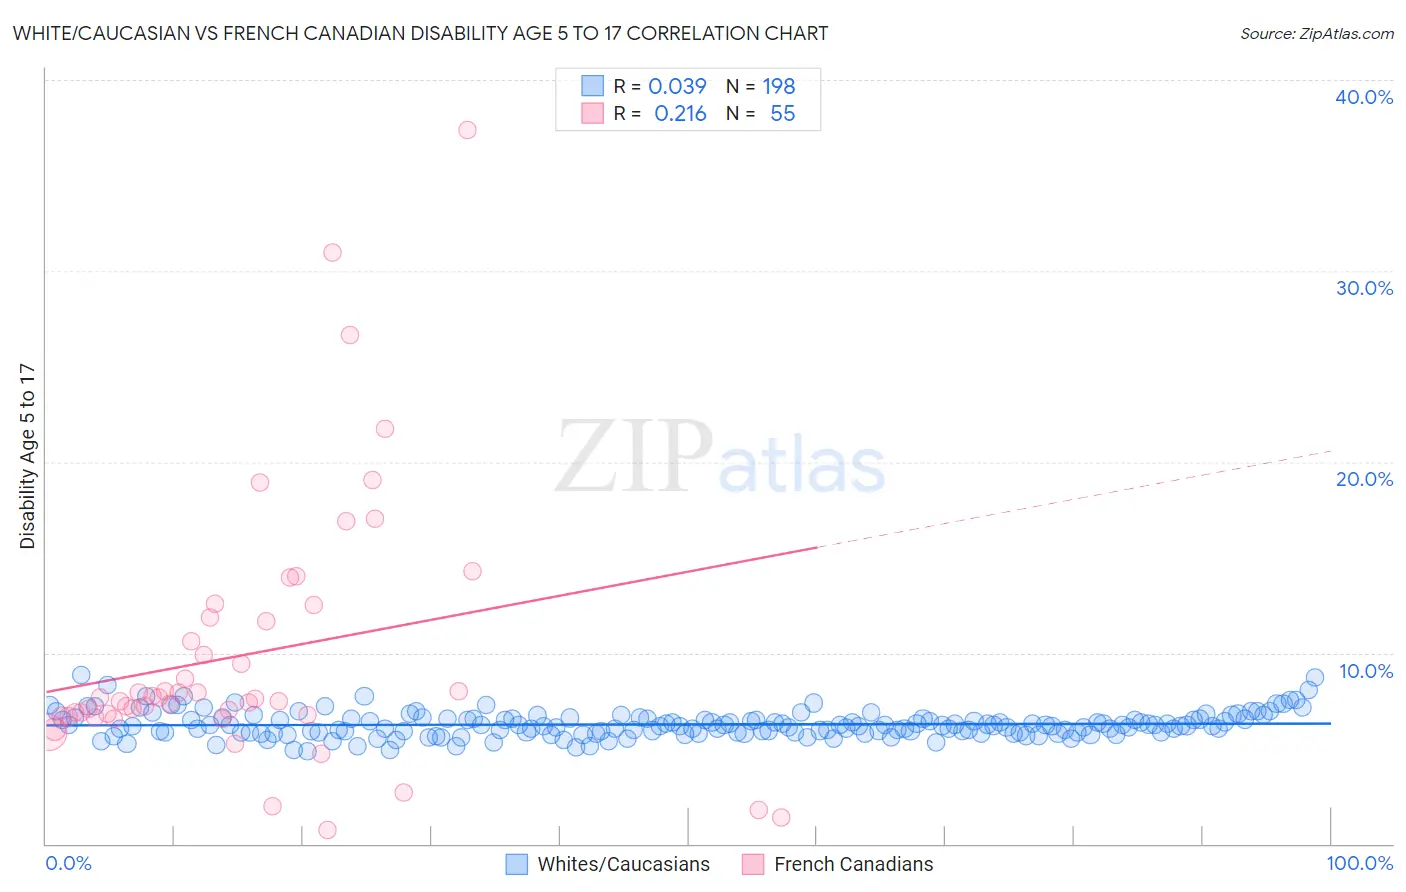
White/Caucasian vs French Canadian Disability Age 5 to 17 Correlation Chart
The statistical analysis conducted on geographies consisting of 566,464,467 people shows no correlation between the proportion of Whites/Caucasians and percentage of population with a disability between the ages 5 and 17 in the United States with a correlation coefficient (R) of 0.039 and weighted average of 6.2%. Similarly, the statistical analysis conducted on geographies consisting of 494,798,155 people shows a weak positive correlation between the proportion of French Canadians and percentage of population with a disability between the ages 5 and 17 in the United States with a correlation coefficient (R) of 0.216 and weighted average of 6.7%, a difference of 8.3%.
Disability Age 5 to 17 Correlation Summary
| Measurement | White/Caucasian | French Canadian |
| Minimum | 4.9% | 0.75% |
| Maximum | 8.8% | 37.4% |
| Range | 4.0% | 36.6% |
| Mean | 6.2% | 9.9% |
| Median | 6.2% | 7.6% |
| Interquartile 25% (IQ1) | 5.8% | 6.7% |
| Interquartile 75% (IQ3) | 6.6% | 11.8% |
| Interquartile Range (IQR) | 0.72% | 5.2% |
| Standard Deviation (Sample) | 0.66% | 6.9% |
| Standard Deviation (Population) | 0.66% | 6.8% |
Similar Demographics by Disability Age 5 to 17
Demographics Similar to Whites/Caucasians by Disability Age 5 to 17
In terms of disability age 5 to 17, the demographic groups most similar to Whites/Caucasians are Jamaican (6.2%, a difference of 0.15%), Yaqui (6.2%, a difference of 0.15%), Immigrants from Congo (6.2%, a difference of 0.15%), Immigrants from Senegal (6.2%, a difference of 0.24%), and Central American Indian (6.2%, a difference of 0.26%).
| Demographics | Rating | Rank | Disability Age 5 to 17 |
| Sub-Saharan Africans | 0.0 /100 | #284 | Tragic 6.2% |
| English | 0.0 /100 | #285 | Tragic 6.2% |
| Colville | 0.0 /100 | #286 | Tragic 6.2% |
| Pima | 0.0 /100 | #287 | Tragic 6.2% |
| Jamaicans | 0.0 /100 | #288 | Tragic 6.2% |
| Yaqui | 0.0 /100 | #289 | Tragic 6.2% |
| Immigrants | Congo | 0.0 /100 | #290 | Tragic 6.2% |
| Whites/Caucasians | 0.0 /100 | #291 | Tragic 6.2% |
| Immigrants | Senegal | 0.0 /100 | #292 | Tragic 6.2% |
| Central American Indians | 0.0 /100 | #293 | Tragic 6.2% |
| Irish | 0.0 /100 | #294 | Tragic 6.2% |
| Cree | 0.0 /100 | #295 | Tragic 6.2% |
| Spanish Americans | 0.0 /100 | #296 | Tragic 6.2% |
| Immigrants | Bahamas | 0.0 /100 | #297 | Tragic 6.2% |
| Lumbee | 0.0 /100 | #298 | Tragic 6.2% |
Demographics Similar to French Canadians by Disability Age 5 to 17
In terms of disability age 5 to 17, the demographic groups most similar to French Canadians are Immigrants from the Azores (6.7%, a difference of 0.020%), Dutch West Indian (6.7%, a difference of 0.080%), Black/African American (6.8%, a difference of 0.61%), Seminole (6.8%, a difference of 0.66%), and Ottawa (6.8%, a difference of 1.4%).
| Demographics | Rating | Rank | Disability Age 5 to 17 |
| Dominicans | 0.0 /100 | #324 | Tragic 6.5% |
| Americans | 0.0 /100 | #325 | Tragic 6.5% |
| Potawatomi | 0.0 /100 | #326 | Tragic 6.5% |
| French American Indians | 0.0 /100 | #327 | Tragic 6.6% |
| Pennsylvania Germans | 0.0 /100 | #328 | Tragic 6.6% |
| Blackfeet | 0.0 /100 | #329 | Tragic 6.6% |
| Dutch West Indians | 0.0 /100 | #330 | Tragic 6.7% |
| French Canadians | 0.0 /100 | #331 | Tragic 6.7% |
| Immigrants | Azores | 0.0 /100 | #332 | Tragic 6.7% |
| Blacks/African Americans | 0.0 /100 | #333 | Tragic 6.8% |
| Seminole | 0.0 /100 | #334 | Tragic 6.8% |
| Ottawa | 0.0 /100 | #335 | Tragic 6.8% |
| Chickasaw | 0.0 /100 | #336 | Tragic 6.8% |
| Creek | 0.0 /100 | #337 | Tragic 6.9% |
| Iroquois | 0.0 /100 | #338 | Tragic 6.9% |