White/Caucasian vs Immigrants from Kuwait Male Unemployment
COMPARE
White/Caucasian
Immigrants from Kuwait
Male Unemployment
Male Unemployment Comparison
Whites/Caucasians
Immigrants from Kuwait
5.0%
MALE UNEMPLOYMENT
97.3/ 100
METRIC RATING
70th/ 347
METRIC RANK
5.1%
MALE UNEMPLOYMENT
93.3/ 100
METRIC RATING
98th/ 347
METRIC RANK
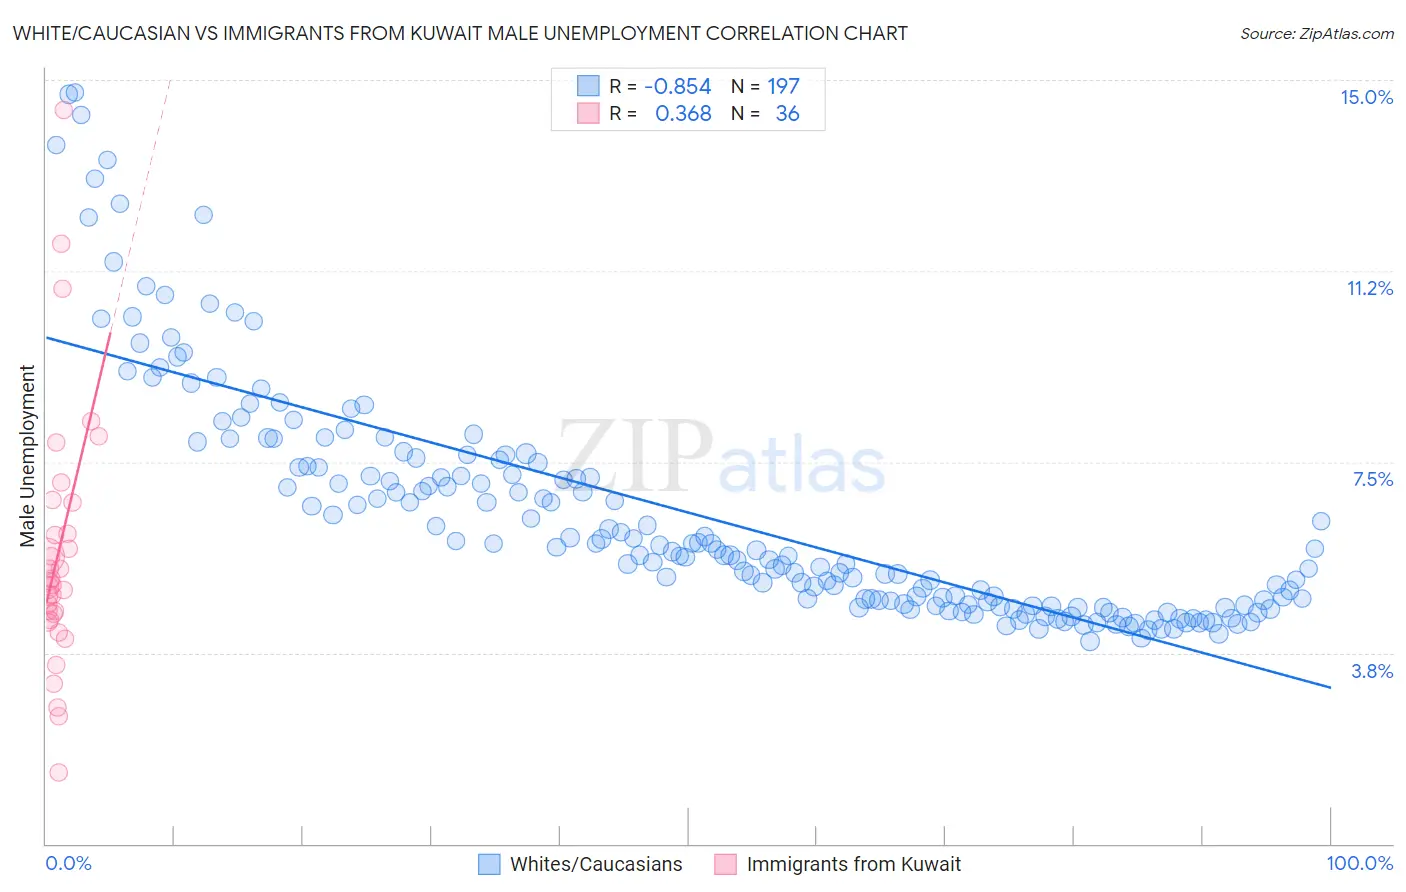
White/Caucasian vs Immigrants from Kuwait Male Unemployment Correlation Chart
The statistical analysis conducted on geographies consisting of 569,852,701 people shows a very strong negative correlation between the proportion of Whites/Caucasians and unemployment rate among males in the United States with a correlation coefficient (R) of -0.854 and weighted average of 5.0%. Similarly, the statistical analysis conducted on geographies consisting of 136,850,948 people shows a mild positive correlation between the proportion of Immigrants from Kuwait and unemployment rate among males in the United States with a correlation coefficient (R) of 0.368 and weighted average of 5.1%, a difference of 1.5%.
Male Unemployment Correlation Summary
| Measurement | White/Caucasian | Immigrants from Kuwait |
| Minimum | 4.0% | 1.4% |
| Maximum | 14.7% | 14.4% |
| Range | 10.8% | 13.0% |
| Mean | 6.5% | 5.7% |
| Median | 5.8% | 5.1% |
| Interquartile 25% (IQ1) | 4.7% | 4.5% |
| Interquartile 75% (IQ3) | 7.4% | 6.4% |
| Interquartile Range (IQR) | 2.7% | 1.9% |
| Standard Deviation (Sample) | 2.3% | 2.5% |
| Standard Deviation (Population) | 2.3% | 2.5% |
Similar Demographics by Male Unemployment
Demographics Similar to Whites/Caucasians by Male Unemployment
In terms of male unemployment, the demographic groups most similar to Whites/Caucasians are New Zealander (5.0%, a difference of 0.020%), Immigrants from Sweden (5.0%, a difference of 0.050%), Australian (5.0%, a difference of 0.080%), Immigrants from Canada (5.0%, a difference of 0.090%), and Immigrants from South Africa (5.0%, a difference of 0.090%).
| Demographics | Rating | Rank | Male Unemployment |
| Eastern Europeans | 97.9 /100 | #63 | Exceptional 5.0% |
| Celtics | 97.8 /100 | #64 | Exceptional 5.0% |
| Icelanders | 97.6 /100 | #65 | Exceptional 5.0% |
| Finns | 97.5 /100 | #66 | Exceptional 5.0% |
| Immigrants | Canada | 97.5 /100 | #67 | Exceptional 5.0% |
| Australians | 97.4 /100 | #68 | Exceptional 5.0% |
| Immigrants | Sweden | 97.4 /100 | #69 | Exceptional 5.0% |
| Whites/Caucasians | 97.3 /100 | #70 | Exceptional 5.0% |
| New Zealanders | 97.3 /100 | #71 | Exceptional 5.0% |
| Immigrants | South Africa | 97.1 /100 | #72 | Exceptional 5.0% |
| Greeks | 97.0 /100 | #73 | Exceptional 5.0% |
| Immigrants | North America | 96.9 /100 | #74 | Exceptional 5.0% |
| Assyrians/Chaldeans/Syriacs | 96.9 /100 | #75 | Exceptional 5.0% |
| Immigrants | Sudan | 96.5 /100 | #76 | Exceptional 5.0% |
| Iranians | 96.4 /100 | #77 | Exceptional 5.0% |
Demographics Similar to Immigrants from Kuwait by Male Unemployment
In terms of male unemployment, the demographic groups most similar to Immigrants from Kuwait are Immigrants from Spain (5.1%, a difference of 0.040%), Uruguayan (5.1%, a difference of 0.070%), Russian (5.1%, a difference of 0.080%), Asian (5.1%, a difference of 0.11%), and German Russian (5.1%, a difference of 0.12%).
| Demographics | Rating | Rank | Male Unemployment |
| Immigrants | Turkey | 94.4 /100 | #91 | Exceptional 5.1% |
| Slavs | 94.2 /100 | #92 | Exceptional 5.1% |
| Immigrants | Serbia | 94.2 /100 | #93 | Exceptional 5.1% |
| Canadians | 94.1 /100 | #94 | Exceptional 5.1% |
| Italians | 93.8 /100 | #95 | Exceptional 5.1% |
| Asians | 93.7 /100 | #96 | Exceptional 5.1% |
| Immigrants | Spain | 93.4 /100 | #97 | Exceptional 5.1% |
| Immigrants | Kuwait | 93.3 /100 | #98 | Exceptional 5.1% |
| Uruguayans | 93.0 /100 | #99 | Exceptional 5.1% |
| Russians | 92.9 /100 | #100 | Exceptional 5.1% |
| German Russians | 92.7 /100 | #101 | Exceptional 5.1% |
| Immigrants | France | 92.7 /100 | #102 | Exceptional 5.1% |
| Immigrants | Jordan | 91.9 /100 | #103 | Exceptional 5.1% |
| Immigrants | Chile | 91.8 /100 | #104 | Exceptional 5.1% |
| Immigrants | Czechoslovakia | 91.7 /100 | #105 | Exceptional 5.1% |