Immigrants from Dominican Republic vs Immigrants from Kuwait Disability
COMPARE
Immigrants from Dominican Republic
Immigrants from Kuwait
Disability
Disability Comparison
Immigrants from Dominican Republic
Immigrants from Kuwait
12.6%
DISABILITY
0.1/ 100
METRIC RATING
269th/ 347
METRIC RANK
10.7%
DISABILITY
100.0/ 100
METRIC RATING
33rd/ 347
METRIC RANK
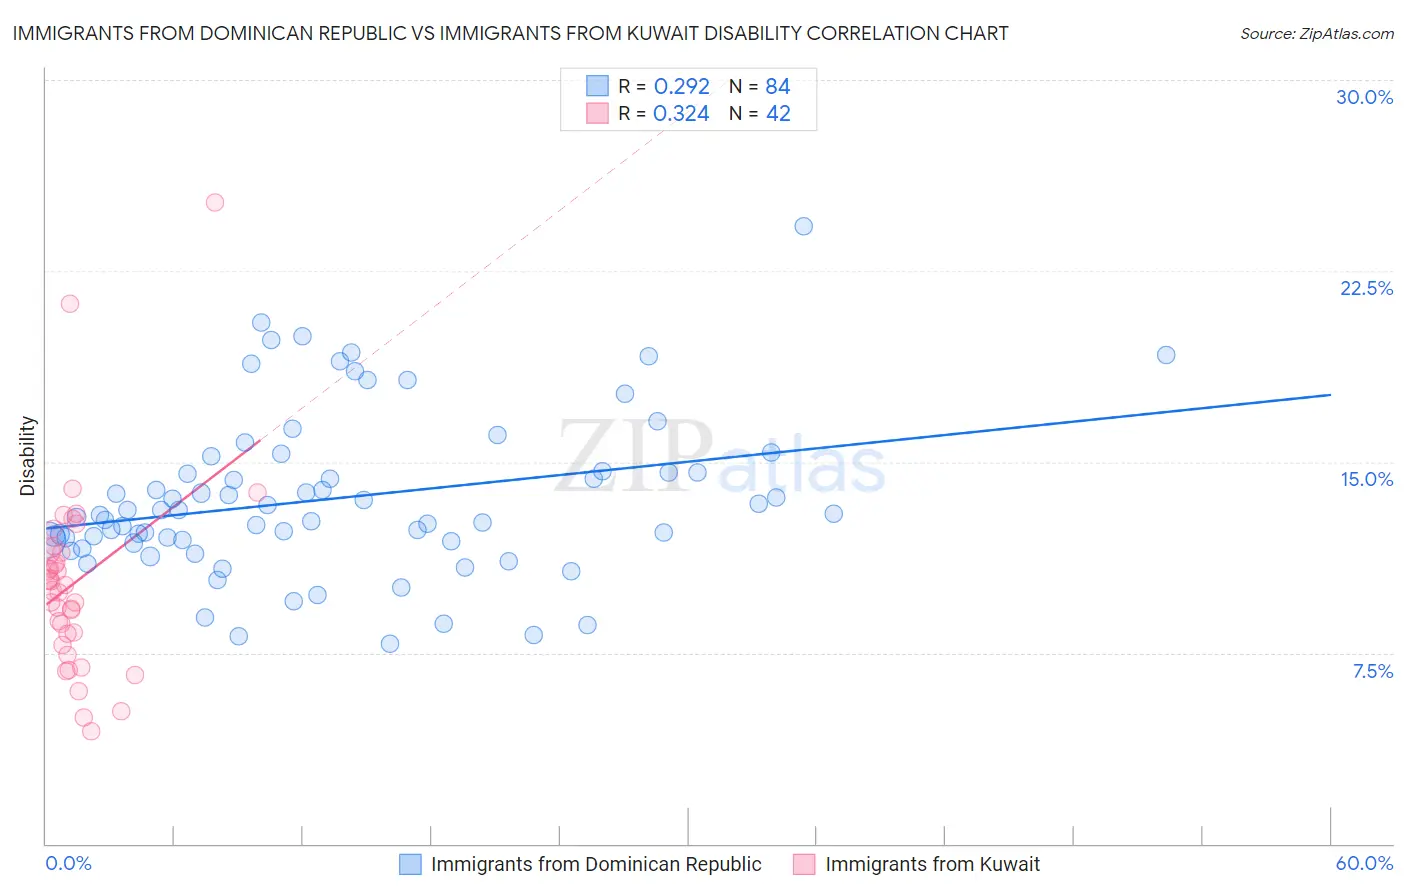
Immigrants from Dominican Republic vs Immigrants from Kuwait Disability Correlation Chart
The statistical analysis conducted on geographies consisting of 275,091,051 people shows a weak positive correlation between the proportion of Immigrants from Dominican Republic and percentage of population with a disability in the United States with a correlation coefficient (R) of 0.292 and weighted average of 12.6%. Similarly, the statistical analysis conducted on geographies consisting of 136,916,630 people shows a mild positive correlation between the proportion of Immigrants from Kuwait and percentage of population with a disability in the United States with a correlation coefficient (R) of 0.324 and weighted average of 10.7%, a difference of 17.8%.
Disability Correlation Summary
| Measurement | Immigrants from Dominican Republic | Immigrants from Kuwait |
| Minimum | 7.9% | 4.4% |
| Maximum | 24.2% | 25.2% |
| Range | 16.4% | 20.8% |
| Mean | 13.6% | 10.3% |
| Median | 12.9% | 10.0% |
| Interquartile 25% (IQ1) | 11.9% | 8.3% |
| Interquartile 75% (IQ3) | 14.6% | 11.5% |
| Interquartile Range (IQR) | 2.7% | 3.2% |
| Standard Deviation (Sample) | 3.2% | 3.8% |
| Standard Deviation (Population) | 3.1% | 3.8% |
Similar Demographics by Disability
Demographics Similar to Immigrants from Dominican Republic by Disability
In terms of disability, the demographic groups most similar to Immigrants from Dominican Republic are Bangladeshi (12.6%, a difference of 0.090%), Portuguese (12.6%, a difference of 0.39%), Spaniard (12.5%, a difference of 0.42%), Immigrants from Yemen (12.6%, a difference of 0.44%), and Czechoslovakian (12.5%, a difference of 0.49%).
| Demographics | Rating | Rank | Disability |
| Native Hawaiians | 0.3 /100 | #262 | Tragic 12.5% |
| Hawaiians | 0.2 /100 | #263 | Tragic 12.5% |
| Immigrants | Germany | 0.2 /100 | #264 | Tragic 12.5% |
| U.S. Virgin Islanders | 0.2 /100 | #265 | Tragic 12.5% |
| Czechoslovakians | 0.2 /100 | #266 | Tragic 12.5% |
| Spaniards | 0.2 /100 | #267 | Tragic 12.5% |
| Bangladeshis | 0.1 /100 | #268 | Tragic 12.6% |
| Immigrants | Dominican Republic | 0.1 /100 | #269 | Tragic 12.6% |
| Portuguese | 0.1 /100 | #270 | Tragic 12.6% |
| Immigrants | Yemen | 0.1 /100 | #271 | Tragic 12.6% |
| Dominicans | 0.0 /100 | #272 | Tragic 12.7% |
| Finns | 0.0 /100 | #273 | Tragic 12.7% |
| Nepalese | 0.0 /100 | #274 | Tragic 12.8% |
| Sioux | 0.0 /100 | #275 | Tragic 12.8% |
| Hmong | 0.0 /100 | #276 | Tragic 12.8% |
Demographics Similar to Immigrants from Kuwait by Disability
In terms of disability, the demographic groups most similar to Immigrants from Kuwait are Immigrants from Ethiopia (10.7%, a difference of 0.22%), Immigrants from Indonesia (10.7%, a difference of 0.23%), Paraguayan (10.6%, a difference of 0.25%), Ethiopian (10.7%, a difference of 0.29%), and Turkish (10.7%, a difference of 0.30%).
| Demographics | Rating | Rank | Disability |
| Argentineans | 100.0 /100 | #26 | Exceptional 10.6% |
| Cypriots | 100.0 /100 | #27 | Exceptional 10.6% |
| Egyptians | 100.0 /100 | #28 | Exceptional 10.6% |
| Immigrants | Argentina | 100.0 /100 | #29 | Exceptional 10.6% |
| Immigrants | Turkey | 100.0 /100 | #30 | Exceptional 10.6% |
| Immigrants | Egypt | 100.0 /100 | #31 | Exceptional 10.6% |
| Paraguayans | 100.0 /100 | #32 | Exceptional 10.6% |
| Immigrants | Kuwait | 100.0 /100 | #33 | Exceptional 10.7% |
| Immigrants | Ethiopia | 100.0 /100 | #34 | Exceptional 10.7% |
| Immigrants | Indonesia | 100.0 /100 | #35 | Exceptional 10.7% |
| Ethiopians | 100.0 /100 | #36 | Exceptional 10.7% |
| Turks | 100.0 /100 | #37 | Exceptional 10.7% |
| Afghans | 99.9 /100 | #38 | Exceptional 10.8% |
| Cambodians | 99.9 /100 | #39 | Exceptional 10.8% |
| Mongolians | 99.9 /100 | #40 | Exceptional 10.8% |