Dutch West Indian vs Hispanic or Latino Disability
COMPARE
Dutch West Indian
Hispanic or Latino
Disability
Disability Comparison
Dutch West Indians
Hispanics or Latinos
14.9%
DISABILITY
0.0/ 100
METRIC RATING
338th/ 347
METRIC RANK
12.1%
DISABILITY
3.9/ 100
METRIC RATING
223rd/ 347
METRIC RANK
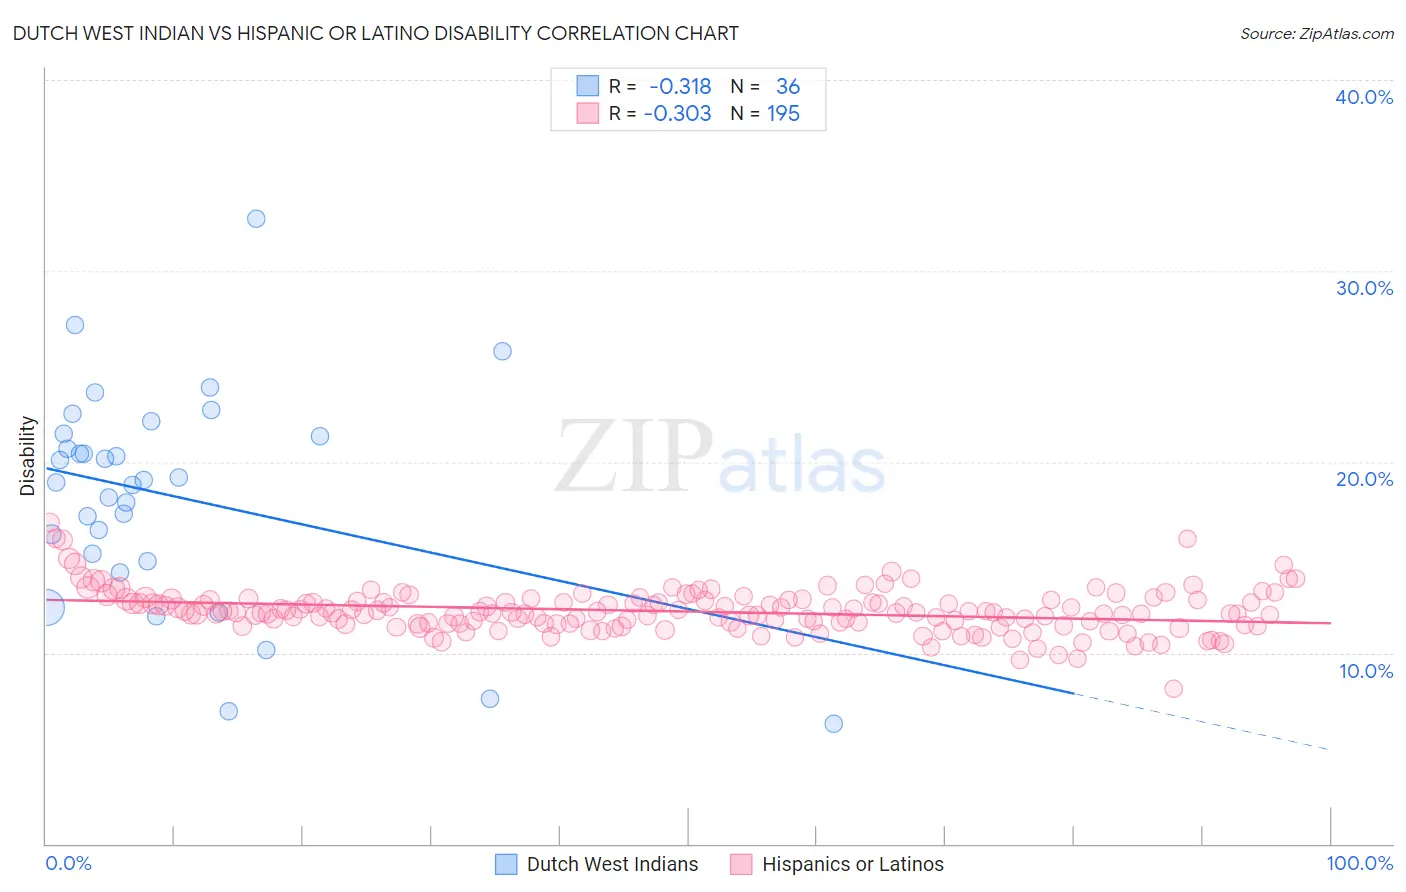
Dutch West Indian vs Hispanic or Latino Disability Correlation Chart
The statistical analysis conducted on geographies consisting of 85,770,416 people shows a mild negative correlation between the proportion of Dutch West Indians and percentage of population with a disability in the United States with a correlation coefficient (R) of -0.318 and weighted average of 14.9%. Similarly, the statistical analysis conducted on geographies consisting of 572,941,997 people shows a mild negative correlation between the proportion of Hispanics or Latinos and percentage of population with a disability in the United States with a correlation coefficient (R) of -0.303 and weighted average of 12.1%, a difference of 23.0%.
Disability Correlation Summary
| Measurement | Dutch West Indian | Hispanic or Latino |
| Minimum | 6.3% | 8.1% |
| Maximum | 32.7% | 16.8% |
| Range | 26.4% | 8.7% |
| Mean | 18.2% | 12.2% |
| Median | 19.0% | 12.1% |
| Interquartile 25% (IQ1) | 15.0% | 11.5% |
| Interquartile 75% (IQ3) | 21.4% | 12.7% |
| Interquartile Range (IQR) | 6.4% | 1.2% |
| Standard Deviation (Sample) | 5.7% | 1.1% |
| Standard Deviation (Population) | 5.6% | 1.1% |
Similar Demographics by Disability
Demographics Similar to Dutch West Indians by Disability
In terms of disability, the demographic groups most similar to Dutch West Indians are Seminole (14.9%, a difference of 0.30%), Cherokee (14.8%, a difference of 0.39%), Tohono O'odham (14.8%, a difference of 0.91%), Chickasaw (15.2%, a difference of 1.8%), and Yuman (14.6%, a difference of 1.9%).
| Demographics | Rating | Rank | Disability |
| Alaskan Athabascans | 0.0 /100 | #331 | Tragic 14.4% |
| Pueblo | 0.0 /100 | #332 | Tragic 14.4% |
| Cajuns | 0.0 /100 | #333 | Tragic 14.6% |
| Yuman | 0.0 /100 | #334 | Tragic 14.6% |
| Tohono O'odham | 0.0 /100 | #335 | Tragic 14.8% |
| Cherokee | 0.0 /100 | #336 | Tragic 14.8% |
| Seminole | 0.0 /100 | #337 | Tragic 14.9% |
| Dutch West Indians | 0.0 /100 | #338 | Tragic 14.9% |
| Chickasaw | 0.0 /100 | #339 | Tragic 15.2% |
| Choctaw | 0.0 /100 | #340 | Tragic 15.4% |
| Lumbee | 0.0 /100 | #341 | Tragic 15.5% |
| Kiowa | 0.0 /100 | #342 | Tragic 15.6% |
| Creek | 0.0 /100 | #343 | Tragic 15.6% |
| Colville | 0.0 /100 | #344 | Tragic 15.8% |
| Puerto Ricans | 0.0 /100 | #345 | Tragic 16.1% |
Demographics Similar to Hispanics or Latinos by Disability
In terms of disability, the demographic groups most similar to Hispanics or Latinos are Spanish American Indian (12.1%, a difference of 0.040%), Mexican (12.1%, a difference of 0.060%), Northern European (12.1%, a difference of 0.070%), Senegalese (12.1%, a difference of 0.15%), and Immigrants from Bahamas (12.1%, a difference of 0.19%).
| Demographics | Rating | Rank | Disability |
| Panamanians | 5.4 /100 | #216 | Tragic 12.1% |
| Immigrants | North America | 5.3 /100 | #217 | Tragic 12.1% |
| Immigrants | Jamaica | 5.0 /100 | #218 | Tragic 12.1% |
| Croatians | 4.9 /100 | #219 | Tragic 12.1% |
| Immigrants | Bahamas | 4.7 /100 | #220 | Tragic 12.1% |
| Northern Europeans | 4.2 /100 | #221 | Tragic 12.1% |
| Spanish American Indians | 4.1 /100 | #222 | Tragic 12.1% |
| Hispanics or Latinos | 3.9 /100 | #223 | Tragic 12.1% |
| Mexicans | 3.7 /100 | #224 | Tragic 12.1% |
| Senegalese | 3.5 /100 | #225 | Tragic 12.1% |
| Jamaicans | 3.3 /100 | #226 | Tragic 12.1% |
| Alsatians | 3.3 /100 | #227 | Tragic 12.1% |
| West Indians | 2.9 /100 | #228 | Tragic 12.2% |
| Inupiat | 2.8 /100 | #229 | Tragic 12.2% |
| Samoans | 2.6 /100 | #230 | Tragic 12.2% |