Cuban vs Hispanic or Latino Disability
COMPARE
Cuban
Hispanic or Latino
Disability
Disability Comparison
Cubans
Hispanics or Latinos
11.7%
DISABILITY
56.7/ 100
METRIC RATING
165th/ 347
METRIC RANK
12.1%
DISABILITY
3.9/ 100
METRIC RATING
223rd/ 347
METRIC RANK
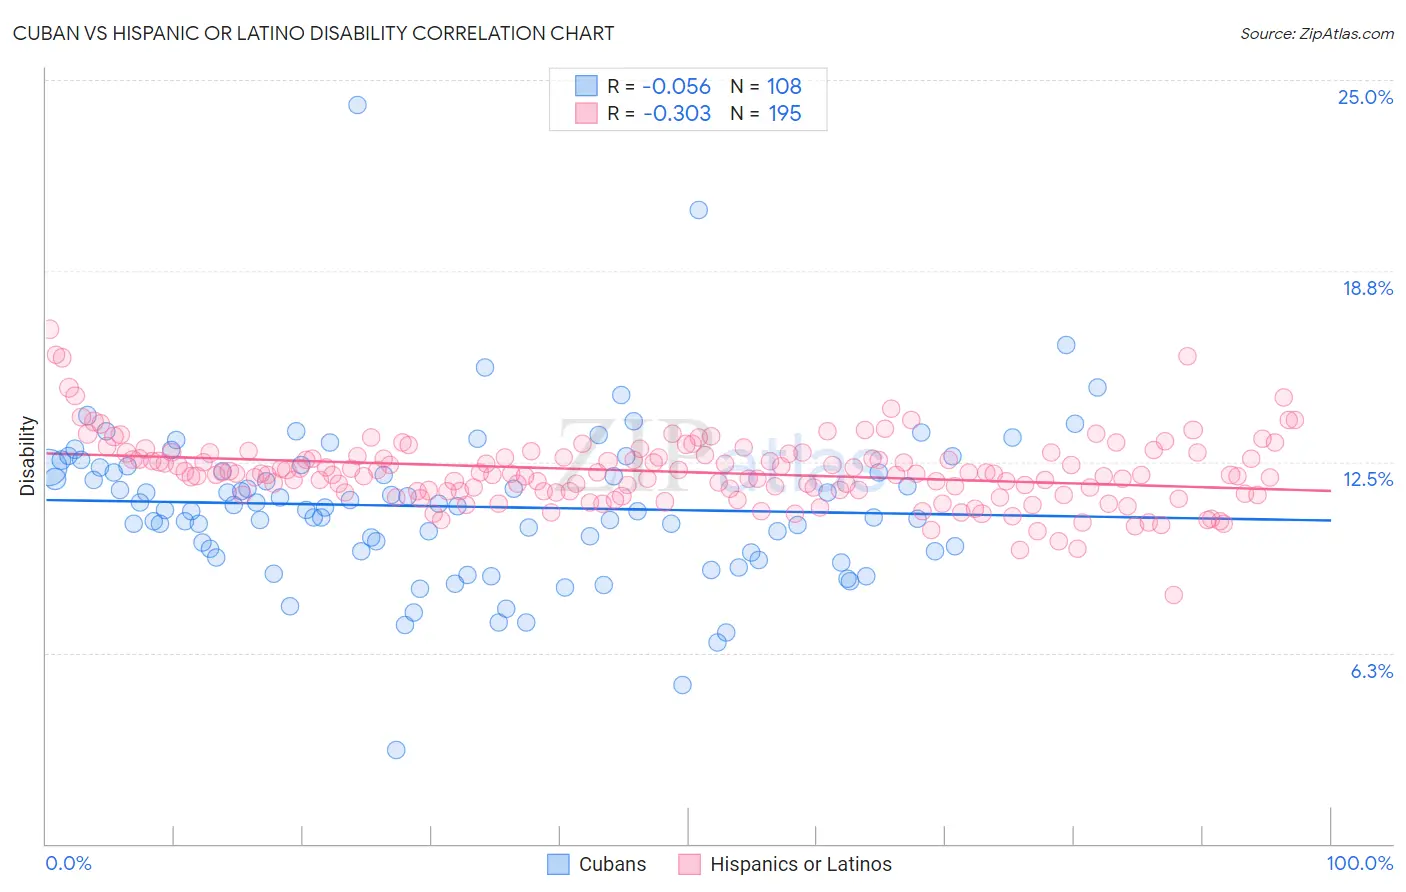
Cuban vs Hispanic or Latino Disability Correlation Chart
The statistical analysis conducted on geographies consisting of 449,280,582 people shows a slight negative correlation between the proportion of Cubans and percentage of population with a disability in the United States with a correlation coefficient (R) of -0.056 and weighted average of 11.7%. Similarly, the statistical analysis conducted on geographies consisting of 572,941,997 people shows a mild negative correlation between the proportion of Hispanics or Latinos and percentage of population with a disability in the United States with a correlation coefficient (R) of -0.303 and weighted average of 12.1%, a difference of 3.8%.
Disability Correlation Summary
| Measurement | Cuban | Hispanic or Latino |
| Minimum | 3.1% | 8.1% |
| Maximum | 24.2% | 16.8% |
| Range | 21.1% | 8.7% |
| Mean | 11.0% | 12.2% |
| Median | 11.0% | 12.1% |
| Interquartile 25% (IQ1) | 9.6% | 11.5% |
| Interquartile 75% (IQ3) | 12.3% | 12.7% |
| Interquartile Range (IQR) | 2.7% | 1.2% |
| Standard Deviation (Sample) | 2.7% | 1.1% |
| Standard Deviation (Population) | 2.6% | 1.1% |
Similar Demographics by Disability
Demographics Similar to Cubans by Disability
In terms of disability, the demographic groups most similar to Cubans are Syrian (11.7%, a difference of 0.080%), Pakistani (11.7%, a difference of 0.090%), Immigrants from Trinidad and Tobago (11.7%, a difference of 0.10%), Estonian (11.7%, a difference of 0.10%), and Immigrants from Haiti (11.7%, a difference of 0.12%).
| Demographics | Rating | Rank | Disability |
| Armenians | 65.9 /100 | #158 | Good 11.6% |
| Guatemalans | 65.1 /100 | #159 | Good 11.6% |
| Immigrants | Barbados | 64.2 /100 | #160 | Good 11.6% |
| Immigrants | Cuba | 62.8 /100 | #161 | Good 11.6% |
| Immigrants | Haiti | 59.2 /100 | #162 | Average 11.7% |
| Immigrants | Trinidad and Tobago | 58.9 /100 | #163 | Average 11.7% |
| Syrians | 58.5 /100 | #164 | Average 11.7% |
| Cubans | 56.7 /100 | #165 | Average 11.7% |
| Pakistanis | 54.7 /100 | #166 | Average 11.7% |
| Estonians | 54.4 /100 | #167 | Average 11.7% |
| Immigrants | Latin America | 54.1 /100 | #168 | Average 11.7% |
| Immigrants | Austria | 53.4 /100 | #169 | Average 11.7% |
| Immigrants | Albania | 52.8 /100 | #170 | Average 11.7% |
| Immigrants | Southern Europe | 52.8 /100 | #171 | Average 11.7% |
| Trinidadians and Tobagonians | 52.7 /100 | #172 | Average 11.7% |
Demographics Similar to Hispanics or Latinos by Disability
In terms of disability, the demographic groups most similar to Hispanics or Latinos are Spanish American Indian (12.1%, a difference of 0.040%), Mexican (12.1%, a difference of 0.060%), Northern European (12.1%, a difference of 0.070%), Senegalese (12.1%, a difference of 0.15%), and Immigrants from Bahamas (12.1%, a difference of 0.19%).
| Demographics | Rating | Rank | Disability |
| Panamanians | 5.4 /100 | #216 | Tragic 12.1% |
| Immigrants | North America | 5.3 /100 | #217 | Tragic 12.1% |
| Immigrants | Jamaica | 5.0 /100 | #218 | Tragic 12.1% |
| Croatians | 4.9 /100 | #219 | Tragic 12.1% |
| Immigrants | Bahamas | 4.7 /100 | #220 | Tragic 12.1% |
| Northern Europeans | 4.2 /100 | #221 | Tragic 12.1% |
| Spanish American Indians | 4.1 /100 | #222 | Tragic 12.1% |
| Hispanics or Latinos | 3.9 /100 | #223 | Tragic 12.1% |
| Mexicans | 3.7 /100 | #224 | Tragic 12.1% |
| Senegalese | 3.5 /100 | #225 | Tragic 12.1% |
| Jamaicans | 3.3 /100 | #226 | Tragic 12.1% |
| Alsatians | 3.3 /100 | #227 | Tragic 12.1% |
| West Indians | 2.9 /100 | #228 | Tragic 12.2% |
| Inupiat | 2.8 /100 | #229 | Tragic 12.2% |
| Samoans | 2.6 /100 | #230 | Tragic 12.2% |