Immigrants from Panama vs Immigrants from West Indies Disability Age 5 to 17
COMPARE
Immigrants from Panama
Immigrants from West Indies
Disability Age 5 to 17
Disability Age 5 to 17 Comparison
Immigrants from Panama
Immigrants from West Indies
5.8%
DISABILITY AGE 5 TO 17
8.7/ 100
METRIC RATING
212th/ 347
METRIC RANK
5.8%
DISABILITY AGE 5 TO 17
3.5/ 100
METRIC RATING
233rd/ 347
METRIC RANK
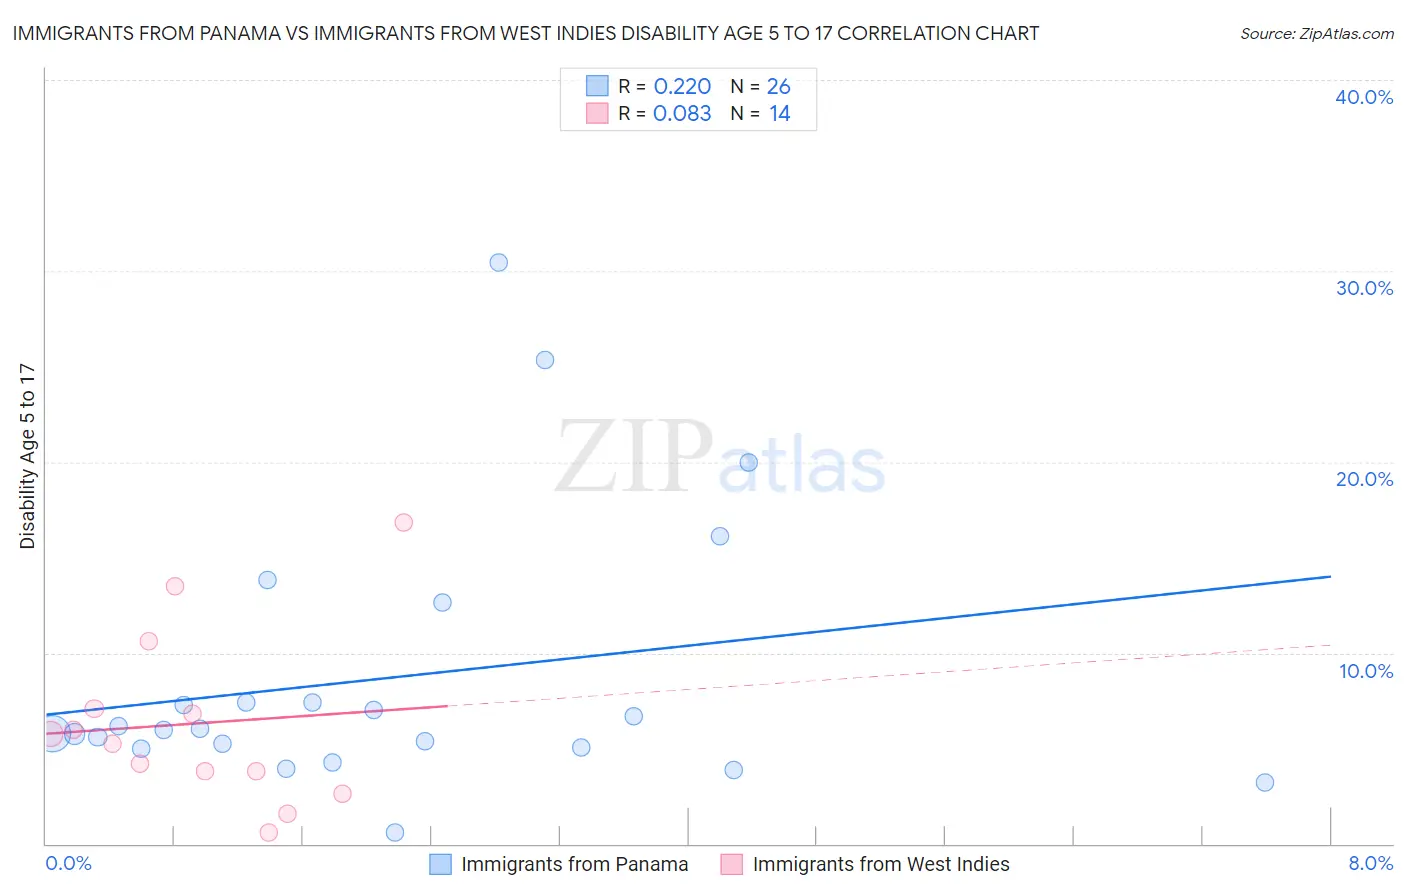
Immigrants from Panama vs Immigrants from West Indies Disability Age 5 to 17 Correlation Chart
The statistical analysis conducted on geographies consisting of 220,612,893 people shows a weak positive correlation between the proportion of Immigrants from Panama and percentage of population with a disability between the ages 5 and 17 in the United States with a correlation coefficient (R) of 0.220 and weighted average of 5.8%. Similarly, the statistical analysis conducted on geographies consisting of 72,374,754 people shows a slight positive correlation between the proportion of Immigrants from West Indies and percentage of population with a disability between the ages 5 and 17 in the United States with a correlation coefficient (R) of 0.083 and weighted average of 5.8%, a difference of 1.1%.
Disability Age 5 to 17 Correlation Summary
| Measurement | Immigrants from Panama | Immigrants from West Indies |
| Minimum | 0.56% | 0.57% |
| Maximum | 30.4% | 16.8% |
| Range | 29.9% | 16.2% |
| Mean | 8.7% | 6.3% |
| Median | 6.0% | 5.5% |
| Interquartile 25% (IQ1) | 5.0% | 3.8% |
| Interquartile 75% (IQ3) | 7.4% | 7.1% |
| Interquartile Range (IQR) | 2.4% | 3.3% |
| Standard Deviation (Sample) | 7.1% | 4.5% |
| Standard Deviation (Population) | 6.9% | 4.4% |
Similar Demographics by Disability Age 5 to 17
Demographics Similar to Immigrants from Panama by Disability Age 5 to 17
In terms of disability age 5 to 17, the demographic groups most similar to Immigrants from Panama are Immigrants from Cameroon (5.8%, a difference of 0.050%), Immigrants from Morocco (5.8%, a difference of 0.050%), Yugoslavian (5.8%, a difference of 0.070%), Swedish (5.8%, a difference of 0.090%), and Immigrants from Haiti (5.8%, a difference of 0.12%).
| Demographics | Rating | Rank | Disability Age 5 to 17 |
| Trinidadians and Tobagonians | 10.8 /100 | #205 | Poor 5.7% |
| Immigrants | Africa | 10.8 /100 | #206 | Poor 5.7% |
| Moroccans | 10.4 /100 | #207 | Poor 5.7% |
| Kenyans | 10.0 /100 | #208 | Poor 5.8% |
| Immigrants | Uganda | 9.7 /100 | #209 | Tragic 5.8% |
| Immigrants | Haiti | 9.5 /100 | #210 | Tragic 5.8% |
| Yugoslavians | 9.1 /100 | #211 | Tragic 5.8% |
| Immigrants | Panama | 8.7 /100 | #212 | Tragic 5.8% |
| Immigrants | Cameroon | 8.3 /100 | #213 | Tragic 5.8% |
| Immigrants | Morocco | 8.3 /100 | #214 | Tragic 5.8% |
| Swedes | 8.1 /100 | #215 | Tragic 5.8% |
| Nigerians | 7.5 /100 | #216 | Tragic 5.8% |
| Czechs | 7.4 /100 | #217 | Tragic 5.8% |
| Immigrants | Sierra Leone | 7.1 /100 | #218 | Tragic 5.8% |
| Sierra Leoneans | 7.0 /100 | #219 | Tragic 5.8% |
Demographics Similar to Immigrants from West Indies by Disability Age 5 to 17
In terms of disability age 5 to 17, the demographic groups most similar to Immigrants from West Indies are Immigrants from Kenya (5.8%, a difference of 0.040%), Malaysian (5.8%, a difference of 0.050%), Immigrants from Laos (5.8%, a difference of 0.090%), Immigrants from Brazil (5.8%, a difference of 0.11%), and Sudanese (5.8%, a difference of 0.26%).
| Demographics | Rating | Rank | Disability Age 5 to 17 |
| British West Indians | 5.4 /100 | #226 | Tragic 5.8% |
| Swiss | 5.1 /100 | #227 | Tragic 5.8% |
| Haitians | 4.8 /100 | #228 | Tragic 5.8% |
| Bangladeshis | 4.8 /100 | #229 | Tragic 5.8% |
| Ghanaians | 4.7 /100 | #230 | Tragic 5.8% |
| Europeans | 4.5 /100 | #231 | Tragic 5.8% |
| Immigrants | Laos | 3.8 /100 | #232 | Tragic 5.8% |
| Immigrants | West Indies | 3.5 /100 | #233 | Tragic 5.8% |
| Immigrants | Kenya | 3.4 /100 | #234 | Tragic 5.8% |
| Malaysians | 3.4 /100 | #235 | Tragic 5.8% |
| Immigrants | Brazil | 3.2 /100 | #236 | Tragic 5.8% |
| Sudanese | 2.9 /100 | #237 | Tragic 5.8% |
| Hungarians | 2.6 /100 | #238 | Tragic 5.8% |
| German Russians | 2.4 /100 | #239 | Tragic 5.9% |
| West Indians | 2.4 /100 | #240 | Tragic 5.9% |