West Indian vs Immigrants from Jordan Cognitive Disability
COMPARE
West Indian
Immigrants from Jordan
Cognitive Disability
Cognitive Disability Comparison
West Indians
Immigrants from Jordan
18.1%
COGNITIVE DISABILITY
0.1/ 100
METRIC RATING
280th/ 347
METRIC RANK
17.0%
COGNITIVE DISABILITY
91.9/ 100
METRIC RATING
133rd/ 347
METRIC RANK
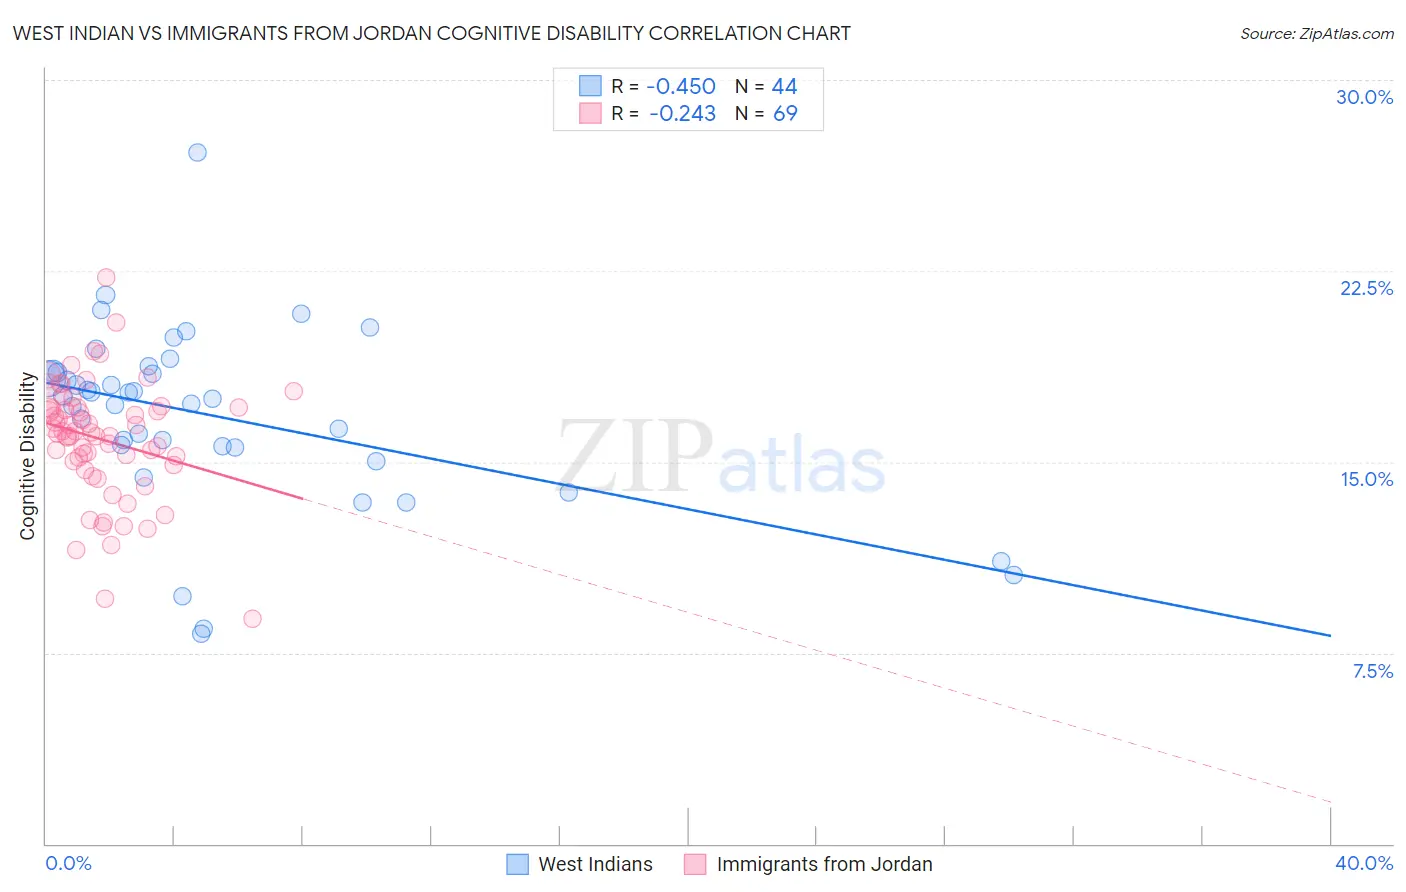
West Indian vs Immigrants from Jordan Cognitive Disability Correlation Chart
The statistical analysis conducted on geographies consisting of 254,021,216 people shows a moderate negative correlation between the proportion of West Indians and percentage of population with cognitive disability in the United States with a correlation coefficient (R) of -0.450 and weighted average of 18.1%. Similarly, the statistical analysis conducted on geographies consisting of 181,275,613 people shows a weak negative correlation between the proportion of Immigrants from Jordan and percentage of population with cognitive disability in the United States with a correlation coefficient (R) of -0.243 and weighted average of 17.0%, a difference of 6.5%.
Cognitive Disability Correlation Summary
| Measurement | West Indian | Immigrants from Jordan |
| Minimum | 8.2% | 8.8% |
| Maximum | 27.1% | 22.2% |
| Range | 18.9% | 13.4% |
| Mean | 16.8% | 15.9% |
| Median | 17.5% | 16.2% |
| Interquartile 25% (IQ1) | 15.6% | 15.0% |
| Interquartile 75% (IQ3) | 18.5% | 17.1% |
| Interquartile Range (IQR) | 2.9% | 2.2% |
| Standard Deviation (Sample) | 3.6% | 2.3% |
| Standard Deviation (Population) | 3.5% | 2.3% |
Similar Demographics by Cognitive Disability
Demographics Similar to West Indians by Cognitive Disability
In terms of cognitive disability, the demographic groups most similar to West Indians are Chippewa (18.1%, a difference of 0.010%), Immigrants from Micronesia (18.1%, a difference of 0.060%), Yuman (18.1%, a difference of 0.070%), Immigrants from Kuwait (18.1%, a difference of 0.070%), and Immigrants from Laos (18.1%, a difference of 0.11%).
| Demographics | Rating | Rank | Cognitive Disability |
| Immigrants | Nepal | 0.2 /100 | #273 | Tragic 18.0% |
| Immigrants | Nigeria | 0.2 /100 | #274 | Tragic 18.0% |
| Immigrants | Laos | 0.2 /100 | #275 | Tragic 18.1% |
| Yuman | 0.2 /100 | #276 | Tragic 18.1% |
| Immigrants | Kuwait | 0.2 /100 | #277 | Tragic 18.1% |
| Immigrants | Micronesia | 0.2 /100 | #278 | Tragic 18.1% |
| Chippewa | 0.1 /100 | #279 | Tragic 18.1% |
| West Indians | 0.1 /100 | #280 | Tragic 18.1% |
| Yakama | 0.1 /100 | #281 | Tragic 18.1% |
| Immigrants | Cambodia | 0.1 /100 | #282 | Tragic 18.1% |
| Nigerians | 0.1 /100 | #283 | Tragic 18.1% |
| Immigrants | Uganda | 0.1 /100 | #284 | Tragic 18.1% |
| Bermudans | 0.1 /100 | #285 | Tragic 18.1% |
| Kenyans | 0.1 /100 | #286 | Tragic 18.1% |
| Dutch West Indians | 0.1 /100 | #287 | Tragic 18.1% |
Demographics Similar to Immigrants from Jordan by Cognitive Disability
In terms of cognitive disability, the demographic groups most similar to Immigrants from Jordan are Immigrants from Chile (17.0%, a difference of 0.020%), Immigrants from Germany (17.0%, a difference of 0.030%), White/Caucasian (17.0%, a difference of 0.030%), Immigrants from Vietnam (17.0%, a difference of 0.050%), and Lebanese (17.0%, a difference of 0.060%).
| Demographics | Rating | Rank | Cognitive Disability |
| Europeans | 93.4 /100 | #126 | Exceptional 17.0% |
| Immigrants | Costa Rica | 93.1 /100 | #127 | Exceptional 17.0% |
| Nicaraguans | 93.0 /100 | #128 | Exceptional 17.0% |
| Immigrants | Uruguay | 92.9 /100 | #129 | Exceptional 17.0% |
| Immigrants | Vietnam | 92.4 /100 | #130 | Exceptional 17.0% |
| Immigrants | Germany | 92.1 /100 | #131 | Exceptional 17.0% |
| Whites/Caucasians | 92.1 /100 | #132 | Exceptional 17.0% |
| Immigrants | Jordan | 91.9 /100 | #133 | Exceptional 17.0% |
| Immigrants | Chile | 91.7 /100 | #134 | Exceptional 17.0% |
| Lebanese | 91.3 /100 | #135 | Exceptional 17.0% |
| Israelis | 91.0 /100 | #136 | Exceptional 17.0% |
| Immigrants | Norway | 90.9 /100 | #137 | Exceptional 17.0% |
| Welsh | 90.8 /100 | #138 | Exceptional 17.0% |
| French | 90.0 /100 | #139 | Excellent 17.0% |
| Chileans | 89.9 /100 | #140 | Excellent 17.0% |