West Indian vs Immigrants from Zimbabwe Cognitive Disability
COMPARE
West Indian
Immigrants from Zimbabwe
Cognitive Disability
Cognitive Disability Comparison
West Indians
Immigrants from Zimbabwe
18.1%
COGNITIVE DISABILITY
0.1/ 100
METRIC RATING
280th/ 347
METRIC RANK
17.5%
COGNITIVE DISABILITY
11.0/ 100
METRIC RATING
204th/ 347
METRIC RANK
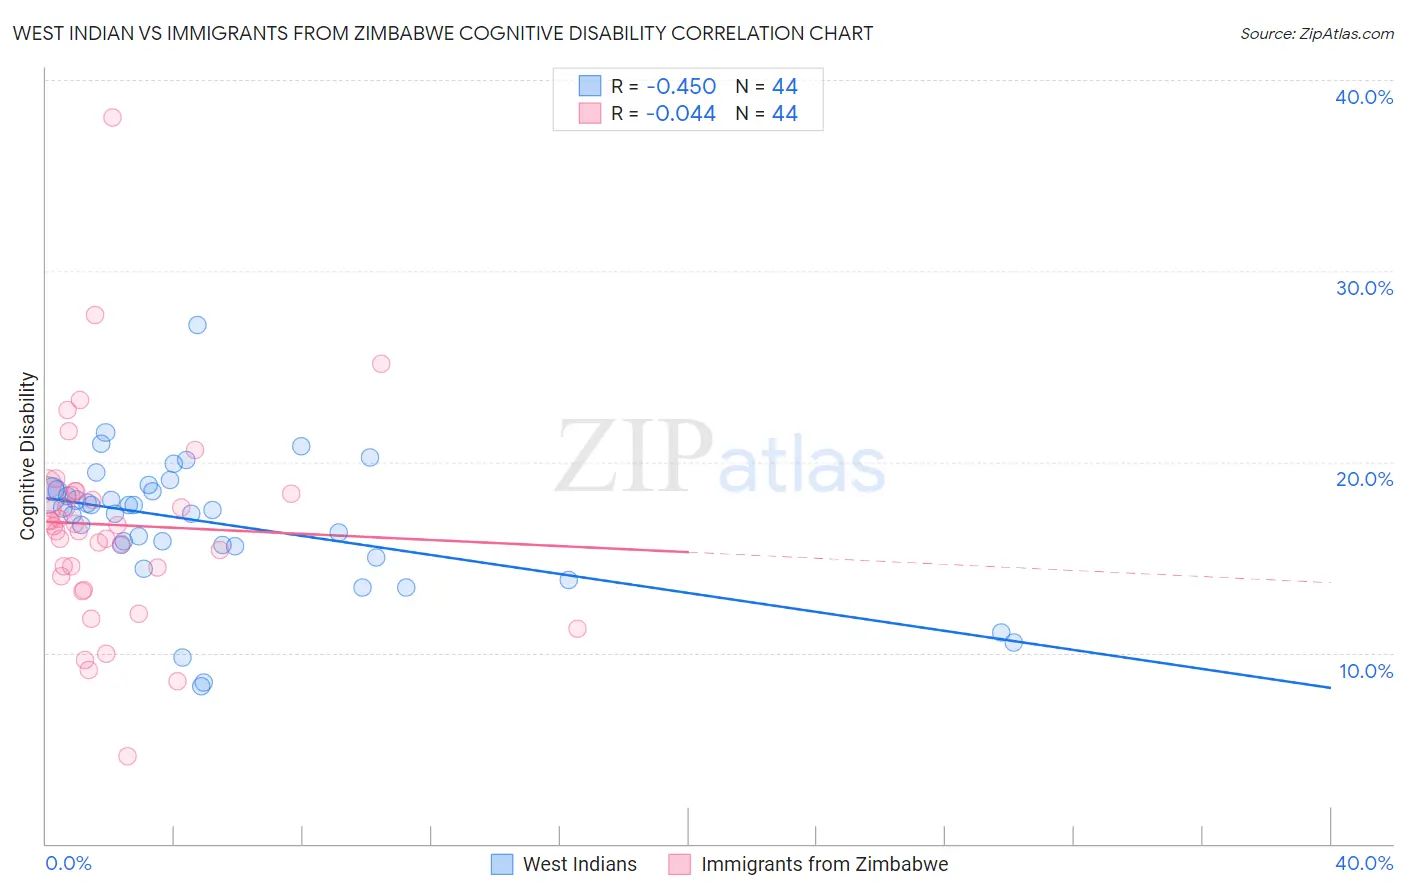
West Indian vs Immigrants from Zimbabwe Cognitive Disability Correlation Chart
The statistical analysis conducted on geographies consisting of 254,021,216 people shows a moderate negative correlation between the proportion of West Indians and percentage of population with cognitive disability in the United States with a correlation coefficient (R) of -0.450 and weighted average of 18.1%. Similarly, the statistical analysis conducted on geographies consisting of 117,811,650 people shows no correlation between the proportion of Immigrants from Zimbabwe and percentage of population with cognitive disability in the United States with a correlation coefficient (R) of -0.044 and weighted average of 17.5%, a difference of 3.1%.
Cognitive Disability Correlation Summary
| Measurement | West Indian | Immigrants from Zimbabwe |
| Minimum | 8.2% | 4.6% |
| Maximum | 27.1% | 38.0% |
| Range | 18.9% | 33.5% |
| Mean | 16.8% | 16.7% |
| Median | 17.5% | 16.7% |
| Interquartile 25% (IQ1) | 15.6% | 14.2% |
| Interquartile 75% (IQ3) | 18.5% | 18.4% |
| Interquartile Range (IQR) | 2.9% | 4.2% |
| Standard Deviation (Sample) | 3.6% | 5.5% |
| Standard Deviation (Population) | 3.5% | 5.4% |
Similar Demographics by Cognitive Disability
Demographics Similar to West Indians by Cognitive Disability
In terms of cognitive disability, the demographic groups most similar to West Indians are Chippewa (18.1%, a difference of 0.010%), Immigrants from Micronesia (18.1%, a difference of 0.060%), Yuman (18.1%, a difference of 0.070%), Immigrants from Kuwait (18.1%, a difference of 0.070%), and Immigrants from Laos (18.1%, a difference of 0.11%).
| Demographics | Rating | Rank | Cognitive Disability |
| Immigrants | Nepal | 0.2 /100 | #273 | Tragic 18.0% |
| Immigrants | Nigeria | 0.2 /100 | #274 | Tragic 18.0% |
| Immigrants | Laos | 0.2 /100 | #275 | Tragic 18.1% |
| Yuman | 0.2 /100 | #276 | Tragic 18.1% |
| Immigrants | Kuwait | 0.2 /100 | #277 | Tragic 18.1% |
| Immigrants | Micronesia | 0.2 /100 | #278 | Tragic 18.1% |
| Chippewa | 0.1 /100 | #279 | Tragic 18.1% |
| West Indians | 0.1 /100 | #280 | Tragic 18.1% |
| Yakama | 0.1 /100 | #281 | Tragic 18.1% |
| Immigrants | Cambodia | 0.1 /100 | #282 | Tragic 18.1% |
| Nigerians | 0.1 /100 | #283 | Tragic 18.1% |
| Immigrants | Uganda | 0.1 /100 | #284 | Tragic 18.1% |
| Bermudans | 0.1 /100 | #285 | Tragic 18.1% |
| Kenyans | 0.1 /100 | #286 | Tragic 18.1% |
| Dutch West Indians | 0.1 /100 | #287 | Tragic 18.1% |
Demographics Similar to Immigrants from Zimbabwe by Cognitive Disability
In terms of cognitive disability, the demographic groups most similar to Immigrants from Zimbabwe are Immigrants from Caribbean (17.5%, a difference of 0.0%), Puget Sound Salish (17.5%, a difference of 0.010%), Alaska Native (17.5%, a difference of 0.040%), Immigrants from Morocco (17.5%, a difference of 0.070%), and Immigrants from Latin America (17.6%, a difference of 0.10%).
| Demographics | Rating | Rank | Cognitive Disability |
| Immigrants | Afghanistan | 16.7 /100 | #197 | Poor 17.5% |
| Immigrants | Panama | 14.8 /100 | #198 | Poor 17.5% |
| Immigrants | Singapore | 14.3 /100 | #199 | Poor 17.5% |
| Haitians | 14.1 /100 | #200 | Poor 17.5% |
| South American Indians | 13.0 /100 | #201 | Poor 17.5% |
| Immigrants | Morocco | 12.0 /100 | #202 | Poor 17.5% |
| Immigrants | Caribbean | 11.0 /100 | #203 | Poor 17.5% |
| Immigrants | Zimbabwe | 11.0 /100 | #204 | Poor 17.5% |
| Puget Sound Salish | 10.9 /100 | #205 | Poor 17.5% |
| Alaska Natives | 10.4 /100 | #206 | Poor 17.5% |
| Immigrants | Latin America | 9.7 /100 | #207 | Tragic 17.6% |
| Immigrants | Cameroon | 9.3 /100 | #208 | Tragic 17.6% |
| Immigrants | Trinidad and Tobago | 8.7 /100 | #209 | Tragic 17.6% |
| Immigrants | Jamaica | 8.5 /100 | #210 | Tragic 17.6% |
| Taiwanese | 7.7 /100 | #211 | Tragic 17.6% |