Estonian vs Immigrants from Jordan Cognitive Disability
COMPARE
Estonian
Immigrants from Jordan
Cognitive Disability
Cognitive Disability Comparison
Estonians
Immigrants from Jordan
16.7%
COGNITIVE DISABILITY
99.3/ 100
METRIC RATING
75th/ 347
METRIC RANK
17.0%
COGNITIVE DISABILITY
91.9/ 100
METRIC RATING
133rd/ 347
METRIC RANK
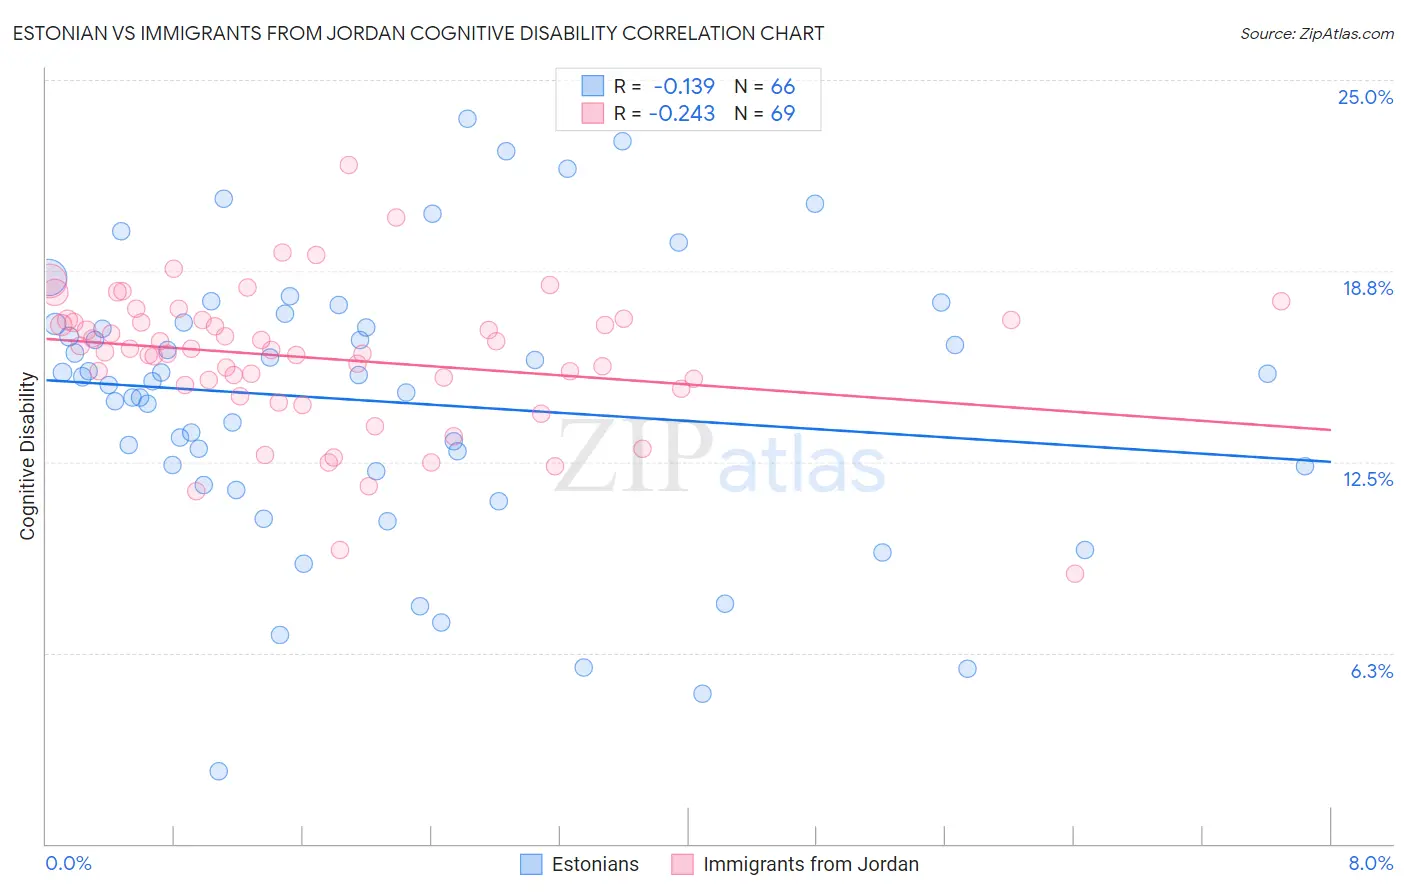
Estonian vs Immigrants from Jordan Cognitive Disability Correlation Chart
The statistical analysis conducted on geographies consisting of 123,512,744 people shows a poor negative correlation between the proportion of Estonians and percentage of population with cognitive disability in the United States with a correlation coefficient (R) of -0.139 and weighted average of 16.7%. Similarly, the statistical analysis conducted on geographies consisting of 181,275,613 people shows a weak negative correlation between the proportion of Immigrants from Jordan and percentage of population with cognitive disability in the United States with a correlation coefficient (R) of -0.243 and weighted average of 17.0%, a difference of 1.9%.
Cognitive Disability Correlation Summary
| Measurement | Estonian | Immigrants from Jordan |
| Minimum | 2.4% | 8.8% |
| Maximum | 23.7% | 22.2% |
| Range | 21.3% | 13.4% |
| Mean | 14.5% | 15.9% |
| Median | 15.2% | 16.2% |
| Interquartile 25% (IQ1) | 12.2% | 15.0% |
| Interquartile 75% (IQ3) | 17.0% | 17.1% |
| Interquartile Range (IQR) | 4.8% | 2.2% |
| Standard Deviation (Sample) | 4.5% | 2.3% |
| Standard Deviation (Population) | 4.5% | 2.3% |
Similar Demographics by Cognitive Disability
Demographics Similar to Estonians by Cognitive Disability
In terms of cognitive disability, the demographic groups most similar to Estonians are Burmese (16.7%, a difference of 0.010%), Slavic (16.7%, a difference of 0.010%), German (16.7%, a difference of 0.020%), Immigrants from Serbia (16.7%, a difference of 0.020%), and Immigrants from Belgium (16.7%, a difference of 0.030%).
| Demographics | Rating | Rank | Cognitive Disability |
| Ukrainians | 99.4 /100 | #68 | Exceptional 16.6% |
| Immigrants | Uzbekistan | 99.4 /100 | #69 | Exceptional 16.7% |
| Immigrants | Sweden | 99.4 /100 | #70 | Exceptional 16.7% |
| Immigrants | Belgium | 99.3 /100 | #71 | Exceptional 16.7% |
| Germans | 99.3 /100 | #72 | Exceptional 16.7% |
| Burmese | 99.3 /100 | #73 | Exceptional 16.7% |
| Slavs | 99.3 /100 | #74 | Exceptional 16.7% |
| Estonians | 99.3 /100 | #75 | Exceptional 16.7% |
| Immigrants | Serbia | 99.3 /100 | #76 | Exceptional 16.7% |
| Immigrants | Hungary | 99.3 /100 | #77 | Exceptional 16.7% |
| Peruvians | 99.3 /100 | #78 | Exceptional 16.7% |
| Immigrants | Bulgaria | 99.3 /100 | #79 | Exceptional 16.7% |
| Egyptians | 99.2 /100 | #80 | Exceptional 16.7% |
| Immigrants | Netherlands | 99.2 /100 | #81 | Exceptional 16.7% |
| Swiss | 99.2 /100 | #82 | Exceptional 16.7% |
Demographics Similar to Immigrants from Jordan by Cognitive Disability
In terms of cognitive disability, the demographic groups most similar to Immigrants from Jordan are Immigrants from Chile (17.0%, a difference of 0.020%), Immigrants from Germany (17.0%, a difference of 0.030%), White/Caucasian (17.0%, a difference of 0.030%), Immigrants from Vietnam (17.0%, a difference of 0.050%), and Lebanese (17.0%, a difference of 0.060%).
| Demographics | Rating | Rank | Cognitive Disability |
| Europeans | 93.4 /100 | #126 | Exceptional 17.0% |
| Immigrants | Costa Rica | 93.1 /100 | #127 | Exceptional 17.0% |
| Nicaraguans | 93.0 /100 | #128 | Exceptional 17.0% |
| Immigrants | Uruguay | 92.9 /100 | #129 | Exceptional 17.0% |
| Immigrants | Vietnam | 92.4 /100 | #130 | Exceptional 17.0% |
| Immigrants | Germany | 92.1 /100 | #131 | Exceptional 17.0% |
| Whites/Caucasians | 92.1 /100 | #132 | Exceptional 17.0% |
| Immigrants | Jordan | 91.9 /100 | #133 | Exceptional 17.0% |
| Immigrants | Chile | 91.7 /100 | #134 | Exceptional 17.0% |
| Lebanese | 91.3 /100 | #135 | Exceptional 17.0% |
| Israelis | 91.0 /100 | #136 | Exceptional 17.0% |
| Immigrants | Norway | 90.9 /100 | #137 | Exceptional 17.0% |
| Welsh | 90.8 /100 | #138 | Exceptional 17.0% |
| French | 90.0 /100 | #139 | Excellent 17.0% |
| Chileans | 89.9 /100 | #140 | Excellent 17.0% |