Bolivian vs Immigrants from Jordan Cognitive Disability
COMPARE
Bolivian
Immigrants from Jordan
Cognitive Disability
Cognitive Disability Comparison
Bolivians
Immigrants from Jordan
16.5%
COGNITIVE DISABILITY
99.9/ 100
METRIC RATING
39th/ 347
METRIC RANK
17.0%
COGNITIVE DISABILITY
91.9/ 100
METRIC RATING
133rd/ 347
METRIC RANK
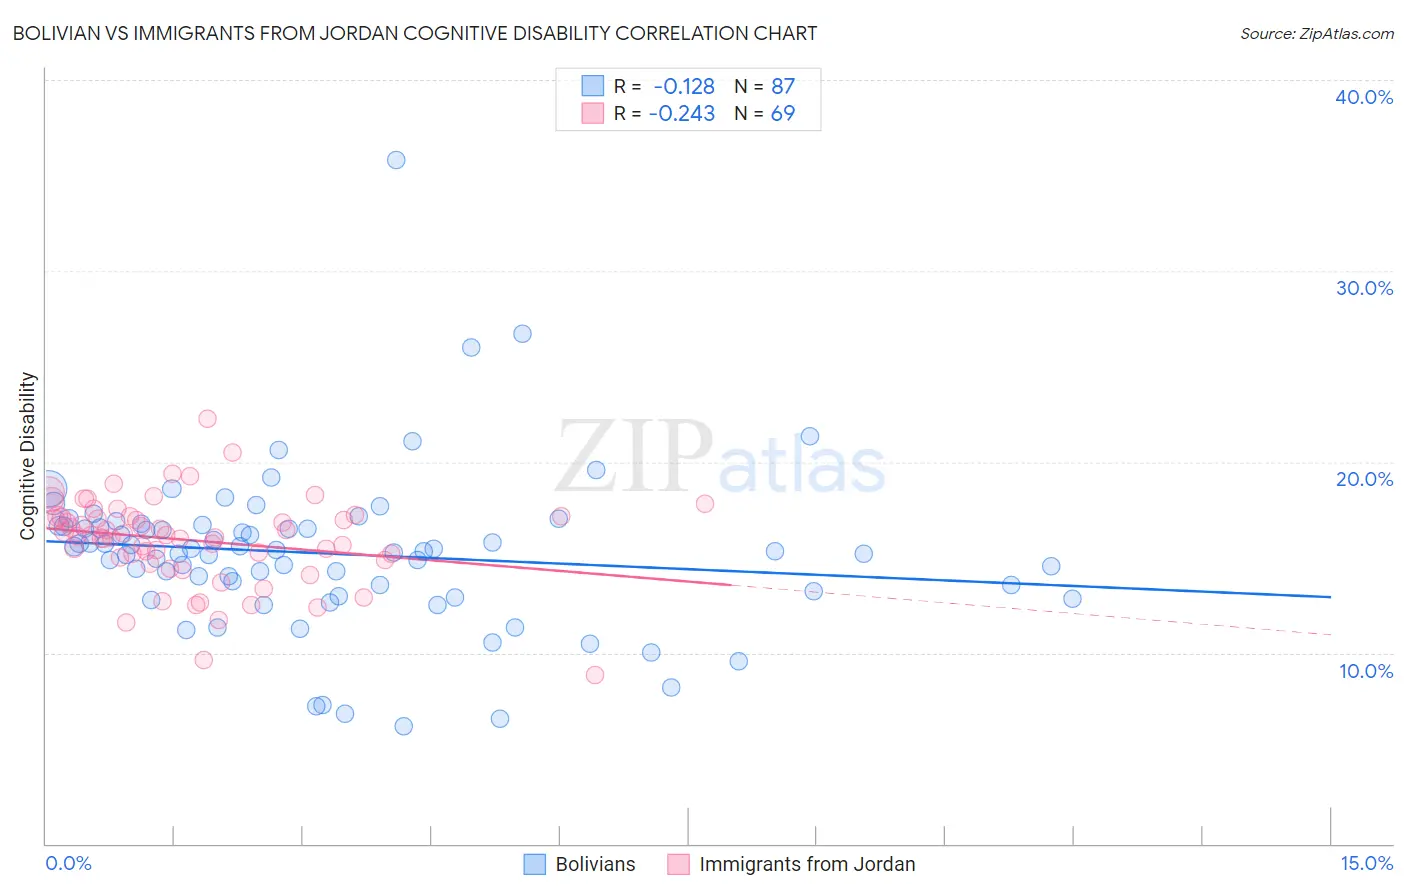
Bolivian vs Immigrants from Jordan Cognitive Disability Correlation Chart
The statistical analysis conducted on geographies consisting of 184,677,815 people shows a poor negative correlation between the proportion of Bolivians and percentage of population with cognitive disability in the United States with a correlation coefficient (R) of -0.128 and weighted average of 16.5%. Similarly, the statistical analysis conducted on geographies consisting of 181,275,613 people shows a weak negative correlation between the proportion of Immigrants from Jordan and percentage of population with cognitive disability in the United States with a correlation coefficient (R) of -0.243 and weighted average of 17.0%, a difference of 3.1%.
Cognitive Disability Correlation Summary
| Measurement | Bolivian | Immigrants from Jordan |
| Minimum | 6.2% | 8.8% |
| Maximum | 35.8% | 22.2% |
| Range | 29.7% | 13.4% |
| Mean | 15.2% | 15.9% |
| Median | 15.3% | 16.2% |
| Interquartile 25% (IQ1) | 13.3% | 15.0% |
| Interquartile 75% (IQ3) | 16.6% | 17.1% |
| Interquartile Range (IQR) | 3.4% | 2.2% |
| Standard Deviation (Sample) | 4.2% | 2.3% |
| Standard Deviation (Population) | 4.2% | 2.3% |
Similar Demographics by Cognitive Disability
Demographics Similar to Bolivians by Cognitive Disability
In terms of cognitive disability, the demographic groups most similar to Bolivians are Immigrants from Belarus (16.5%, a difference of 0.010%), Cuban (16.5%, a difference of 0.020%), Hungarian (16.5%, a difference of 0.030%), Immigrants from Eastern Europe (16.5%, a difference of 0.070%), and Slovene (16.5%, a difference of 0.090%).
| Demographics | Rating | Rank | Cognitive Disability |
| Immigrants | Israel | 99.9 /100 | #32 | Exceptional 16.4% |
| Italians | 99.9 /100 | #33 | Exceptional 16.4% |
| Russians | 99.9 /100 | #34 | Exceptional 16.4% |
| Slovaks | 99.9 /100 | #35 | Exceptional 16.4% |
| Greeks | 99.9 /100 | #36 | Exceptional 16.4% |
| Slovenes | 99.9 /100 | #37 | Exceptional 16.5% |
| Immigrants | Eastern Europe | 99.9 /100 | #38 | Exceptional 16.5% |
| Bolivians | 99.9 /100 | #39 | Exceptional 16.5% |
| Immigrants | Belarus | 99.9 /100 | #40 | Exceptional 16.5% |
| Cubans | 99.9 /100 | #41 | Exceptional 16.5% |
| Hungarians | 99.9 /100 | #42 | Exceptional 16.5% |
| Immigrants | Canada | 99.8 /100 | #43 | Exceptional 16.5% |
| Macedonians | 99.8 /100 | #44 | Exceptional 16.5% |
| Immigrants | Europe | 99.8 /100 | #45 | Exceptional 16.5% |
| Immigrants | Colombia | 99.8 /100 | #46 | Exceptional 16.5% |
Demographics Similar to Immigrants from Jordan by Cognitive Disability
In terms of cognitive disability, the demographic groups most similar to Immigrants from Jordan are Immigrants from Chile (17.0%, a difference of 0.020%), Immigrants from Germany (17.0%, a difference of 0.030%), White/Caucasian (17.0%, a difference of 0.030%), Immigrants from Vietnam (17.0%, a difference of 0.050%), and Lebanese (17.0%, a difference of 0.060%).
| Demographics | Rating | Rank | Cognitive Disability |
| Europeans | 93.4 /100 | #126 | Exceptional 17.0% |
| Immigrants | Costa Rica | 93.1 /100 | #127 | Exceptional 17.0% |
| Nicaraguans | 93.0 /100 | #128 | Exceptional 17.0% |
| Immigrants | Uruguay | 92.9 /100 | #129 | Exceptional 17.0% |
| Immigrants | Vietnam | 92.4 /100 | #130 | Exceptional 17.0% |
| Immigrants | Germany | 92.1 /100 | #131 | Exceptional 17.0% |
| Whites/Caucasians | 92.1 /100 | #132 | Exceptional 17.0% |
| Immigrants | Jordan | 91.9 /100 | #133 | Exceptional 17.0% |
| Immigrants | Chile | 91.7 /100 | #134 | Exceptional 17.0% |
| Lebanese | 91.3 /100 | #135 | Exceptional 17.0% |
| Israelis | 91.0 /100 | #136 | Exceptional 17.0% |
| Immigrants | Norway | 90.9 /100 | #137 | Exceptional 17.0% |
| Welsh | 90.8 /100 | #138 | Exceptional 17.0% |
| French | 90.0 /100 | #139 | Excellent 17.0% |
| Chileans | 89.9 /100 | #140 | Excellent 17.0% |