West Indian vs Greek Cognitive Disability
COMPARE
West Indian
Greek
Cognitive Disability
Cognitive Disability Comparison
West Indians
Greeks
18.1%
COGNITIVE DISABILITY
0.1/ 100
METRIC RATING
280th/ 347
METRIC RANK
16.4%
COGNITIVE DISABILITY
99.9/ 100
METRIC RATING
36th/ 347
METRIC RANK
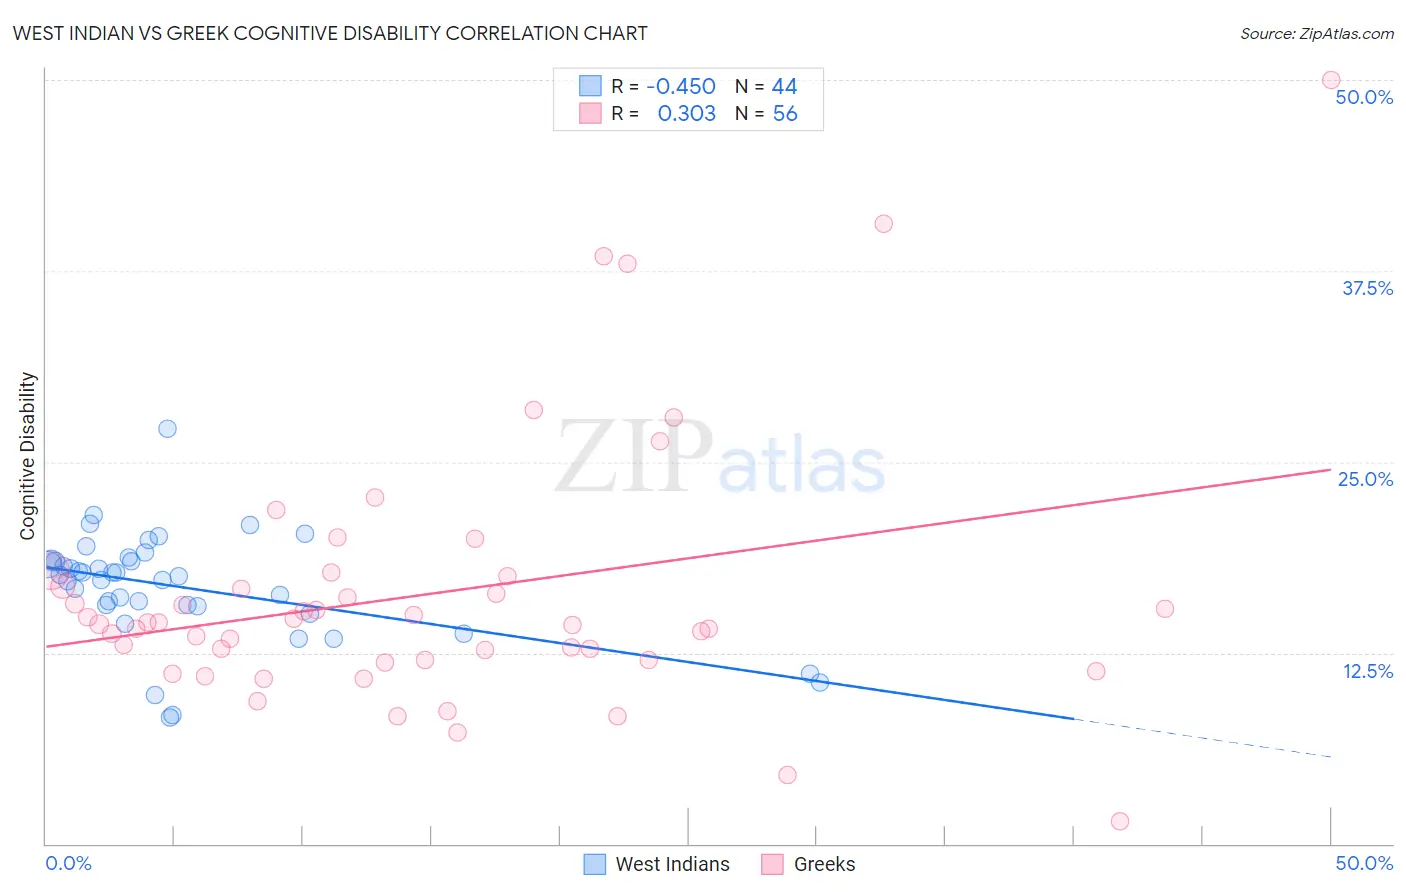
West Indian vs Greek Cognitive Disability Correlation Chart
The statistical analysis conducted on geographies consisting of 254,021,216 people shows a moderate negative correlation between the proportion of West Indians and percentage of population with cognitive disability in the United States with a correlation coefficient (R) of -0.450 and weighted average of 18.1%. Similarly, the statistical analysis conducted on geographies consisting of 482,712,046 people shows a mild positive correlation between the proportion of Greeks and percentage of population with cognitive disability in the United States with a correlation coefficient (R) of 0.303 and weighted average of 16.4%, a difference of 10.1%.
Cognitive Disability Correlation Summary
| Measurement | West Indian | Greek |
| Minimum | 8.2% | 1.5% |
| Maximum | 27.1% | 50.0% |
| Range | 18.9% | 48.5% |
| Mean | 16.8% | 16.4% |
| Median | 17.5% | 14.4% |
| Interquartile 25% (IQ1) | 15.6% | 12.0% |
| Interquartile 75% (IQ3) | 18.5% | 17.2% |
| Interquartile Range (IQR) | 2.9% | 5.2% |
| Standard Deviation (Sample) | 3.6% | 8.7% |
| Standard Deviation (Population) | 3.5% | 8.6% |
Similar Demographics by Cognitive Disability
Demographics Similar to West Indians by Cognitive Disability
In terms of cognitive disability, the demographic groups most similar to West Indians are Chippewa (18.1%, a difference of 0.010%), Immigrants from Micronesia (18.1%, a difference of 0.060%), Yuman (18.1%, a difference of 0.070%), Immigrants from Kuwait (18.1%, a difference of 0.070%), and Immigrants from Laos (18.1%, a difference of 0.11%).
| Demographics | Rating | Rank | Cognitive Disability |
| Immigrants | Nepal | 0.2 /100 | #273 | Tragic 18.0% |
| Immigrants | Nigeria | 0.2 /100 | #274 | Tragic 18.0% |
| Immigrants | Laos | 0.2 /100 | #275 | Tragic 18.1% |
| Yuman | 0.2 /100 | #276 | Tragic 18.1% |
| Immigrants | Kuwait | 0.2 /100 | #277 | Tragic 18.1% |
| Immigrants | Micronesia | 0.2 /100 | #278 | Tragic 18.1% |
| Chippewa | 0.1 /100 | #279 | Tragic 18.1% |
| West Indians | 0.1 /100 | #280 | Tragic 18.1% |
| Yakama | 0.1 /100 | #281 | Tragic 18.1% |
| Immigrants | Cambodia | 0.1 /100 | #282 | Tragic 18.1% |
| Nigerians | 0.1 /100 | #283 | Tragic 18.1% |
| Immigrants | Uganda | 0.1 /100 | #284 | Tragic 18.1% |
| Bermudans | 0.1 /100 | #285 | Tragic 18.1% |
| Kenyans | 0.1 /100 | #286 | Tragic 18.1% |
| Dutch West Indians | 0.1 /100 | #287 | Tragic 18.1% |
Demographics Similar to Greeks by Cognitive Disability
In terms of cognitive disability, the demographic groups most similar to Greeks are Slovak (16.4%, a difference of 0.010%), Italian (16.4%, a difference of 0.090%), Russian (16.4%, a difference of 0.090%), Slovene (16.5%, a difference of 0.15%), and Immigrants from Israel (16.4%, a difference of 0.16%).
| Demographics | Rating | Rank | Cognitive Disability |
| Filipinos | 99.9 /100 | #29 | Exceptional 16.4% |
| Czechs | 99.9 /100 | #30 | Exceptional 16.4% |
| Immigrants | Romania | 99.9 /100 | #31 | Exceptional 16.4% |
| Immigrants | Israel | 99.9 /100 | #32 | Exceptional 16.4% |
| Italians | 99.9 /100 | #33 | Exceptional 16.4% |
| Russians | 99.9 /100 | #34 | Exceptional 16.4% |
| Slovaks | 99.9 /100 | #35 | Exceptional 16.4% |
| Greeks | 99.9 /100 | #36 | Exceptional 16.4% |
| Slovenes | 99.9 /100 | #37 | Exceptional 16.5% |
| Immigrants | Eastern Europe | 99.9 /100 | #38 | Exceptional 16.5% |
| Bolivians | 99.9 /100 | #39 | Exceptional 16.5% |
| Immigrants | Belarus | 99.9 /100 | #40 | Exceptional 16.5% |
| Cubans | 99.9 /100 | #41 | Exceptional 16.5% |
| Hungarians | 99.9 /100 | #42 | Exceptional 16.5% |
| Immigrants | Canada | 99.8 /100 | #43 | Exceptional 16.5% |