Finnish vs Immigrants from Jordan Cognitive Disability
COMPARE
Finnish
Immigrants from Jordan
Cognitive Disability
Cognitive Disability Comparison
Finns
Immigrants from Jordan
16.8%
COGNITIVE DISABILITY
98.5/ 100
METRIC RATING
96th/ 347
METRIC RANK
17.0%
COGNITIVE DISABILITY
91.9/ 100
METRIC RATING
133rd/ 347
METRIC RANK
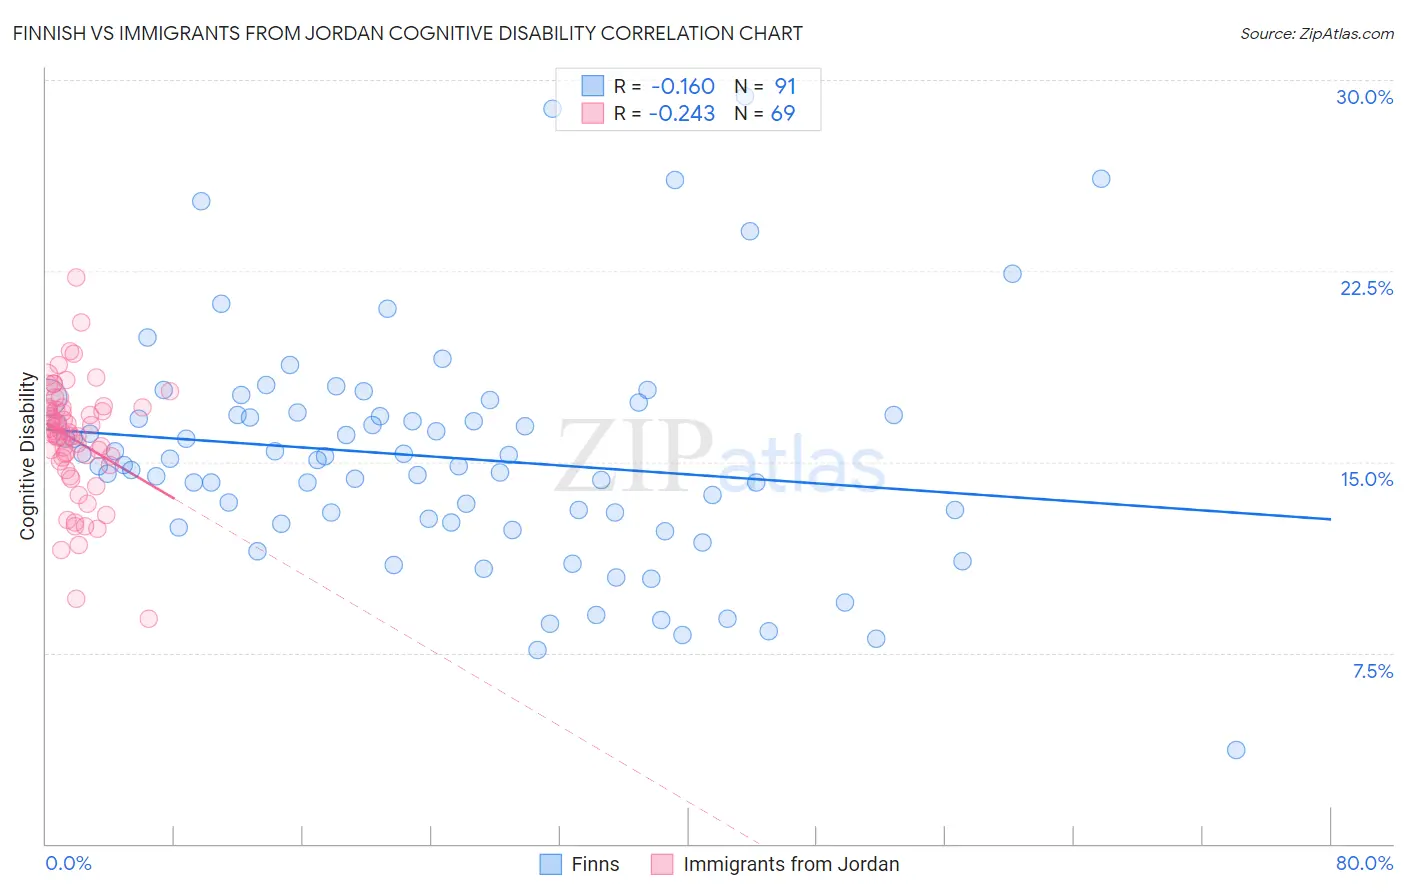
Finnish vs Immigrants from Jordan Cognitive Disability Correlation Chart
The statistical analysis conducted on geographies consisting of 404,634,462 people shows a poor negative correlation between the proportion of Finns and percentage of population with cognitive disability in the United States with a correlation coefficient (R) of -0.160 and weighted average of 16.8%. Similarly, the statistical analysis conducted on geographies consisting of 181,275,613 people shows a weak negative correlation between the proportion of Immigrants from Jordan and percentage of population with cognitive disability in the United States with a correlation coefficient (R) of -0.243 and weighted average of 17.0%, a difference of 1.3%.
Cognitive Disability Correlation Summary
| Measurement | Finnish | Immigrants from Jordan |
| Minimum | 3.7% | 8.8% |
| Maximum | 29.3% | 22.2% |
| Range | 25.6% | 13.4% |
| Mean | 15.2% | 15.9% |
| Median | 15.1% | 16.2% |
| Interquartile 25% (IQ1) | 12.6% | 15.0% |
| Interquartile 75% (IQ3) | 16.9% | 17.1% |
| Interquartile Range (IQR) | 4.2% | 2.2% |
| Standard Deviation (Sample) | 4.5% | 2.3% |
| Standard Deviation (Population) | 4.5% | 2.3% |
Similar Demographics by Cognitive Disability
Demographics Similar to Finns by Cognitive Disability
In terms of cognitive disability, the demographic groups most similar to Finns are Dutch (16.8%, a difference of 0.010%), English (16.8%, a difference of 0.020%), Immigrants from Lebanon (16.8%, a difference of 0.040%), Asian (16.7%, a difference of 0.090%), and Jordanian (16.8%, a difference of 0.12%).
| Demographics | Rating | Rank | Cognitive Disability |
| Immigrants | Egypt | 98.8 /100 | #89 | Exceptional 16.7% |
| South Americans | 98.8 /100 | #90 | Exceptional 16.7% |
| Danes | 98.8 /100 | #91 | Exceptional 16.7% |
| Immigrants | South America | 98.8 /100 | #92 | Exceptional 16.7% |
| Immigrants | Southern Europe | 98.7 /100 | #93 | Exceptional 16.7% |
| Asians | 98.7 /100 | #94 | Exceptional 16.7% |
| English | 98.6 /100 | #95 | Exceptional 16.8% |
| Finns | 98.5 /100 | #96 | Exceptional 16.8% |
| Dutch | 98.5 /100 | #97 | Exceptional 16.8% |
| Immigrants | Lebanon | 98.4 /100 | #98 | Exceptional 16.8% |
| Jordanians | 98.2 /100 | #99 | Exceptional 16.8% |
| Immigrants | Russia | 98.2 /100 | #100 | Exceptional 16.8% |
| Immigrants | Asia | 98.1 /100 | #101 | Exceptional 16.8% |
| Irish | 98.1 /100 | #102 | Exceptional 16.8% |
| Paraguayans | 98.0 /100 | #103 | Exceptional 16.8% |
Demographics Similar to Immigrants from Jordan by Cognitive Disability
In terms of cognitive disability, the demographic groups most similar to Immigrants from Jordan are Immigrants from Chile (17.0%, a difference of 0.020%), Immigrants from Germany (17.0%, a difference of 0.030%), White/Caucasian (17.0%, a difference of 0.030%), Immigrants from Vietnam (17.0%, a difference of 0.050%), and Lebanese (17.0%, a difference of 0.060%).
| Demographics | Rating | Rank | Cognitive Disability |
| Europeans | 93.4 /100 | #126 | Exceptional 17.0% |
| Immigrants | Costa Rica | 93.1 /100 | #127 | Exceptional 17.0% |
| Nicaraguans | 93.0 /100 | #128 | Exceptional 17.0% |
| Immigrants | Uruguay | 92.9 /100 | #129 | Exceptional 17.0% |
| Immigrants | Vietnam | 92.4 /100 | #130 | Exceptional 17.0% |
| Immigrants | Germany | 92.1 /100 | #131 | Exceptional 17.0% |
| Whites/Caucasians | 92.1 /100 | #132 | Exceptional 17.0% |
| Immigrants | Jordan | 91.9 /100 | #133 | Exceptional 17.0% |
| Immigrants | Chile | 91.7 /100 | #134 | Exceptional 17.0% |
| Lebanese | 91.3 /100 | #135 | Exceptional 17.0% |
| Israelis | 91.0 /100 | #136 | Exceptional 17.0% |
| Immigrants | Norway | 90.9 /100 | #137 | Exceptional 17.0% |
| Welsh | 90.8 /100 | #138 | Exceptional 17.0% |
| French | 90.0 /100 | #139 | Excellent 17.0% |
| Chileans | 89.9 /100 | #140 | Excellent 17.0% |