West Indian vs Soviet Union Cognitive Disability
COMPARE
West Indian
Soviet Union
Cognitive Disability
Cognitive Disability Comparison
West Indians
Soviet Union
18.1%
COGNITIVE DISABILITY
0.1/ 100
METRIC RATING
280th/ 347
METRIC RANK
16.5%
COGNITIVE DISABILITY
99.8/ 100
METRIC RATING
52nd/ 347
METRIC RANK
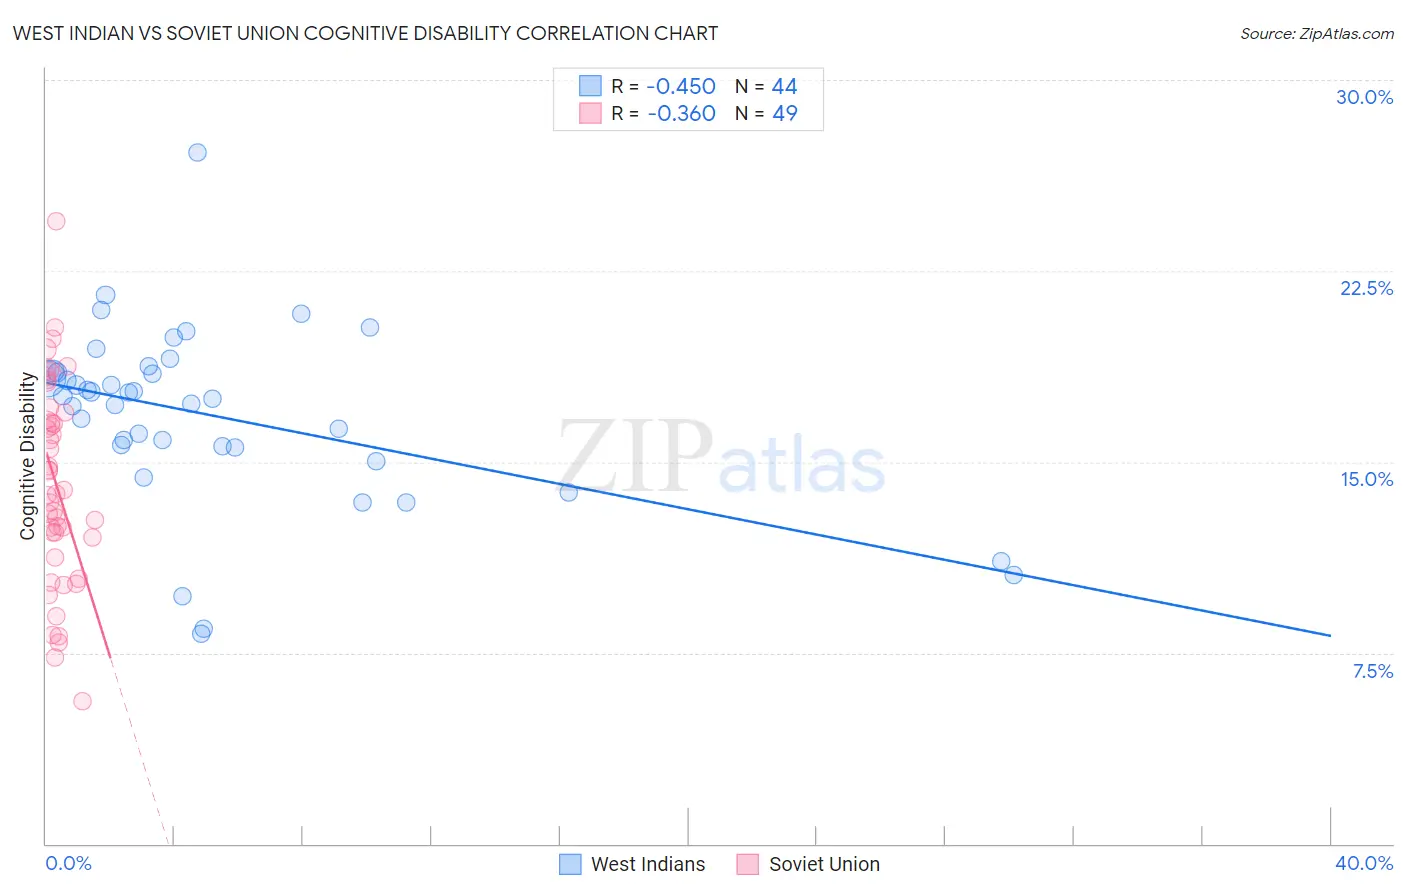
West Indian vs Soviet Union Cognitive Disability Correlation Chart
The statistical analysis conducted on geographies consisting of 254,021,216 people shows a moderate negative correlation between the proportion of West Indians and percentage of population with cognitive disability in the United States with a correlation coefficient (R) of -0.450 and weighted average of 18.1%. Similarly, the statistical analysis conducted on geographies consisting of 43,504,324 people shows a mild negative correlation between the proportion of Soviet Union and percentage of population with cognitive disability in the United States with a correlation coefficient (R) of -0.360 and weighted average of 16.5%, a difference of 9.5%.
Cognitive Disability Correlation Summary
| Measurement | West Indian | Soviet Union |
| Minimum | 8.2% | 5.6% |
| Maximum | 27.1% | 24.4% |
| Range | 18.9% | 18.8% |
| Mean | 16.8% | 14.1% |
| Median | 17.5% | 13.7% |
| Interquartile 25% (IQ1) | 15.6% | 11.6% |
| Interquartile 75% (IQ3) | 18.5% | 16.8% |
| Interquartile Range (IQR) | 2.9% | 5.2% |
| Standard Deviation (Sample) | 3.6% | 3.9% |
| Standard Deviation (Population) | 3.5% | 3.9% |
Similar Demographics by Cognitive Disability
Demographics Similar to West Indians by Cognitive Disability
In terms of cognitive disability, the demographic groups most similar to West Indians are Chippewa (18.1%, a difference of 0.010%), Immigrants from Micronesia (18.1%, a difference of 0.060%), Yuman (18.1%, a difference of 0.070%), Immigrants from Kuwait (18.1%, a difference of 0.070%), and Immigrants from Laos (18.1%, a difference of 0.11%).
| Demographics | Rating | Rank | Cognitive Disability |
| Immigrants | Nepal | 0.2 /100 | #273 | Tragic 18.0% |
| Immigrants | Nigeria | 0.2 /100 | #274 | Tragic 18.0% |
| Immigrants | Laos | 0.2 /100 | #275 | Tragic 18.1% |
| Yuman | 0.2 /100 | #276 | Tragic 18.1% |
| Immigrants | Kuwait | 0.2 /100 | #277 | Tragic 18.1% |
| Immigrants | Micronesia | 0.2 /100 | #278 | Tragic 18.1% |
| Chippewa | 0.1 /100 | #279 | Tragic 18.1% |
| West Indians | 0.1 /100 | #280 | Tragic 18.1% |
| Yakama | 0.1 /100 | #281 | Tragic 18.1% |
| Immigrants | Cambodia | 0.1 /100 | #282 | Tragic 18.1% |
| Nigerians | 0.1 /100 | #283 | Tragic 18.1% |
| Immigrants | Uganda | 0.1 /100 | #284 | Tragic 18.1% |
| Bermudans | 0.1 /100 | #285 | Tragic 18.1% |
| Kenyans | 0.1 /100 | #286 | Tragic 18.1% |
| Dutch West Indians | 0.1 /100 | #287 | Tragic 18.1% |
Demographics Similar to Soviet Union by Cognitive Disability
In terms of cognitive disability, the demographic groups most similar to Soviet Union are Immigrants from Korea (16.5%, a difference of 0.040%), Swedish (16.5%, a difference of 0.060%), Iranian (16.5%, a difference of 0.090%), Norwegian (16.5%, a difference of 0.090%), and Immigrants from Iran (16.5%, a difference of 0.10%).
| Demographics | Rating | Rank | Cognitive Disability |
| Immigrants | Europe | 99.8 /100 | #45 | Exceptional 16.5% |
| Immigrants | Colombia | 99.8 /100 | #46 | Exceptional 16.5% |
| Immigrants | Italy | 99.8 /100 | #47 | Exceptional 16.5% |
| Immigrants | North America | 99.8 /100 | #48 | Exceptional 16.5% |
| Iranians | 99.8 /100 | #49 | Exceptional 16.5% |
| Norwegians | 99.8 /100 | #50 | Exceptional 16.5% |
| Immigrants | Korea | 99.8 /100 | #51 | Exceptional 16.5% |
| Soviet Union | 99.8 /100 | #52 | Exceptional 16.5% |
| Swedes | 99.8 /100 | #53 | Exceptional 16.5% |
| Immigrants | Iran | 99.8 /100 | #54 | Exceptional 16.5% |
| Immigrants | Venezuela | 99.7 /100 | #55 | Exceptional 16.5% |
| Austrians | 99.7 /100 | #56 | Exceptional 16.6% |
| Bhutanese | 99.7 /100 | #57 | Exceptional 16.6% |
| Pennsylvania Germans | 99.7 /100 | #58 | Exceptional 16.6% |
| Immigrants | Peru | 99.7 /100 | #59 | Exceptional 16.6% |