West Indian vs Guamanian/Chamorro Cognitive Disability
COMPARE
West Indian
Guamanian/Chamorro
Cognitive Disability
Cognitive Disability Comparison
West Indians
Guamanians/Chamorros
18.1%
COGNITIVE DISABILITY
0.1/ 100
METRIC RATING
280th/ 347
METRIC RANK
17.9%
COGNITIVE DISABILITY
0.5/ 100
METRIC RATING
261st/ 347
METRIC RANK
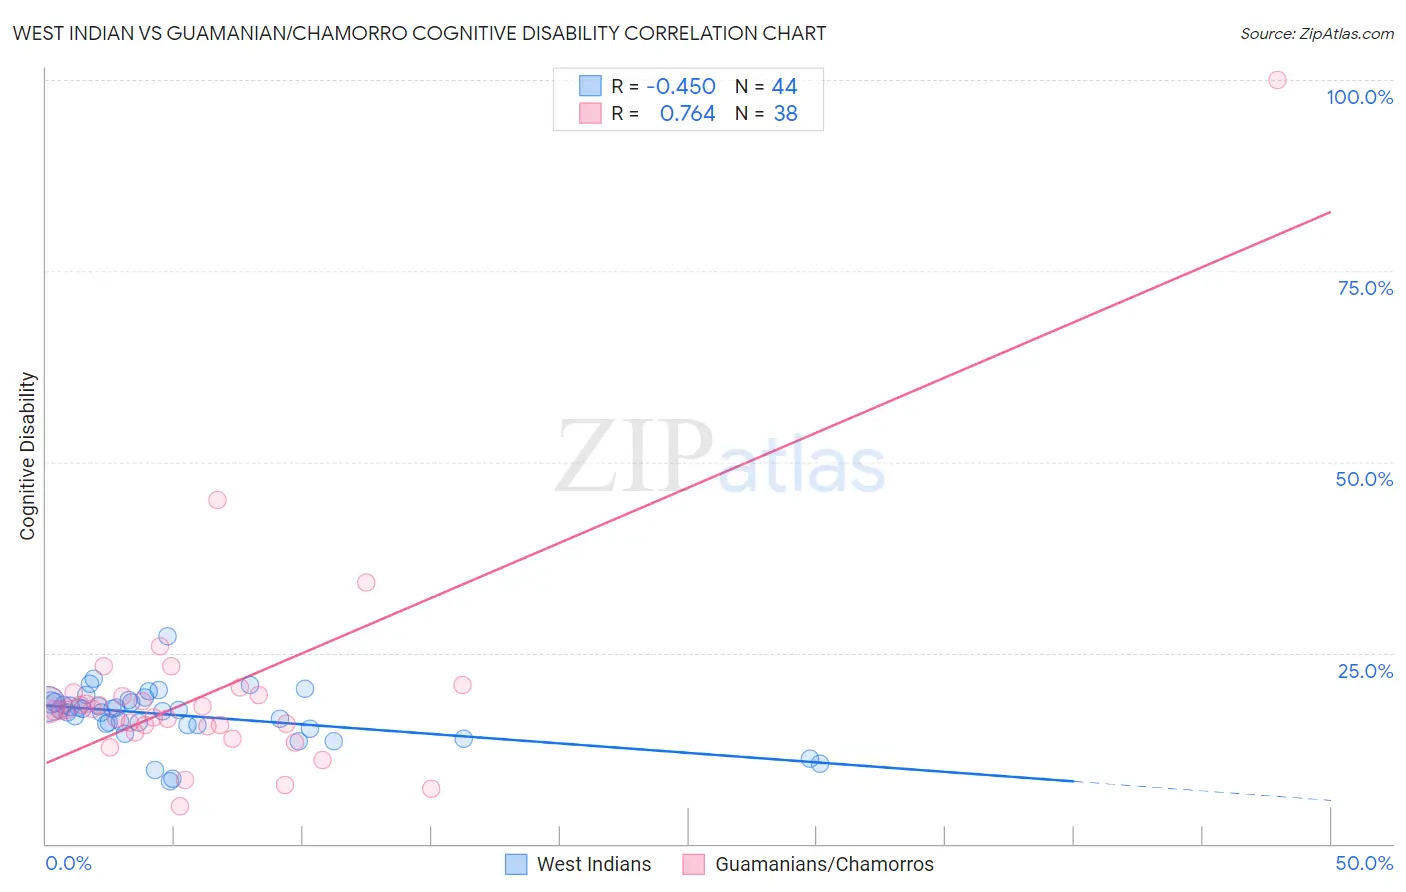
West Indian vs Guamanian/Chamorro Cognitive Disability Correlation Chart
The statistical analysis conducted on geographies consisting of 254,021,216 people shows a moderate negative correlation between the proportion of West Indians and percentage of population with cognitive disability in the United States with a correlation coefficient (R) of -0.450 and weighted average of 18.1%. Similarly, the statistical analysis conducted on geographies consisting of 221,888,944 people shows a strong positive correlation between the proportion of Guamanians/Chamorros and percentage of population with cognitive disability in the United States with a correlation coefficient (R) of 0.764 and weighted average of 17.9%, a difference of 0.82%.
Cognitive Disability Correlation Summary
| Measurement | West Indian | Guamanian/Chamorro |
| Minimum | 8.2% | 5.0% |
| Maximum | 27.1% | 100.0% |
| Range | 18.9% | 95.0% |
| Mean | 16.8% | 19.8% |
| Median | 17.5% | 17.5% |
| Interquartile 25% (IQ1) | 15.6% | 15.4% |
| Interquartile 75% (IQ3) | 18.5% | 19.5% |
| Interquartile Range (IQR) | 2.9% | 4.0% |
| Standard Deviation (Sample) | 3.6% | 15.1% |
| Standard Deviation (Population) | 3.5% | 14.9% |
Demographics Similar to West Indians and Guamanians/Chamorros by Cognitive Disability
In terms of cognitive disability, the demographic groups most similar to West Indians are Chippewa (18.1%, a difference of 0.010%), Immigrants from Micronesia (18.1%, a difference of 0.060%), Yuman (18.1%, a difference of 0.070%), Immigrants from Kuwait (18.1%, a difference of 0.070%), and Immigrants from Laos (18.1%, a difference of 0.11%). Similarly, the demographic groups most similar to Guamanians/Chamorros are Sierra Leonean (17.9%, a difference of 0.030%), Immigrants from Belize (17.9%, a difference of 0.050%), Immigrants from Barbados (17.9%, a difference of 0.070%), Menominee (18.0%, a difference of 0.13%), and Spanish American (18.0%, a difference of 0.16%).
| Demographics | Rating | Rank | Cognitive Disability |
| Immigrants | Belize | 0.5 /100 | #260 | Tragic 17.9% |
| Guamanians/Chamorros | 0.5 /100 | #261 | Tragic 17.9% |
| Sierra Leoneans | 0.4 /100 | #262 | Tragic 17.9% |
| Immigrants | Barbados | 0.4 /100 | #263 | Tragic 17.9% |
| Menominee | 0.4 /100 | #264 | Tragic 18.0% |
| Spanish Americans | 0.4 /100 | #265 | Tragic 18.0% |
| Belizeans | 0.4 /100 | #266 | Tragic 18.0% |
| Nepalese | 0.3 /100 | #267 | Tragic 18.0% |
| Cherokee | 0.3 /100 | #268 | Tragic 18.0% |
| Hondurans | 0.3 /100 | #269 | Tragic 18.0% |
| Immigrants | Bahamas | 0.3 /100 | #270 | Tragic 18.0% |
| Potawatomi | 0.2 /100 | #271 | Tragic 18.0% |
| Immigrants | Honduras | 0.2 /100 | #272 | Tragic 18.0% |
| Immigrants | Nepal | 0.2 /100 | #273 | Tragic 18.0% |
| Immigrants | Nigeria | 0.2 /100 | #274 | Tragic 18.0% |
| Immigrants | Laos | 0.2 /100 | #275 | Tragic 18.1% |
| Yuman | 0.2 /100 | #276 | Tragic 18.1% |
| Immigrants | Kuwait | 0.2 /100 | #277 | Tragic 18.1% |
| Immigrants | Micronesia | 0.2 /100 | #278 | Tragic 18.1% |
| Chippewa | 0.1 /100 | #279 | Tragic 18.1% |
| West Indians | 0.1 /100 | #280 | Tragic 18.1% |