Immigrants from Indonesia vs Immigrants from Jordan Cognitive Disability
COMPARE
Immigrants from Indonesia
Immigrants from Jordan
Cognitive Disability
Cognitive Disability Comparison
Immigrants from Indonesia
Immigrants from Jordan
17.1%
COGNITIVE DISABILITY
82.7/ 100
METRIC RATING
152nd/ 347
METRIC RANK
17.0%
COGNITIVE DISABILITY
91.9/ 100
METRIC RATING
133rd/ 347
METRIC RANK
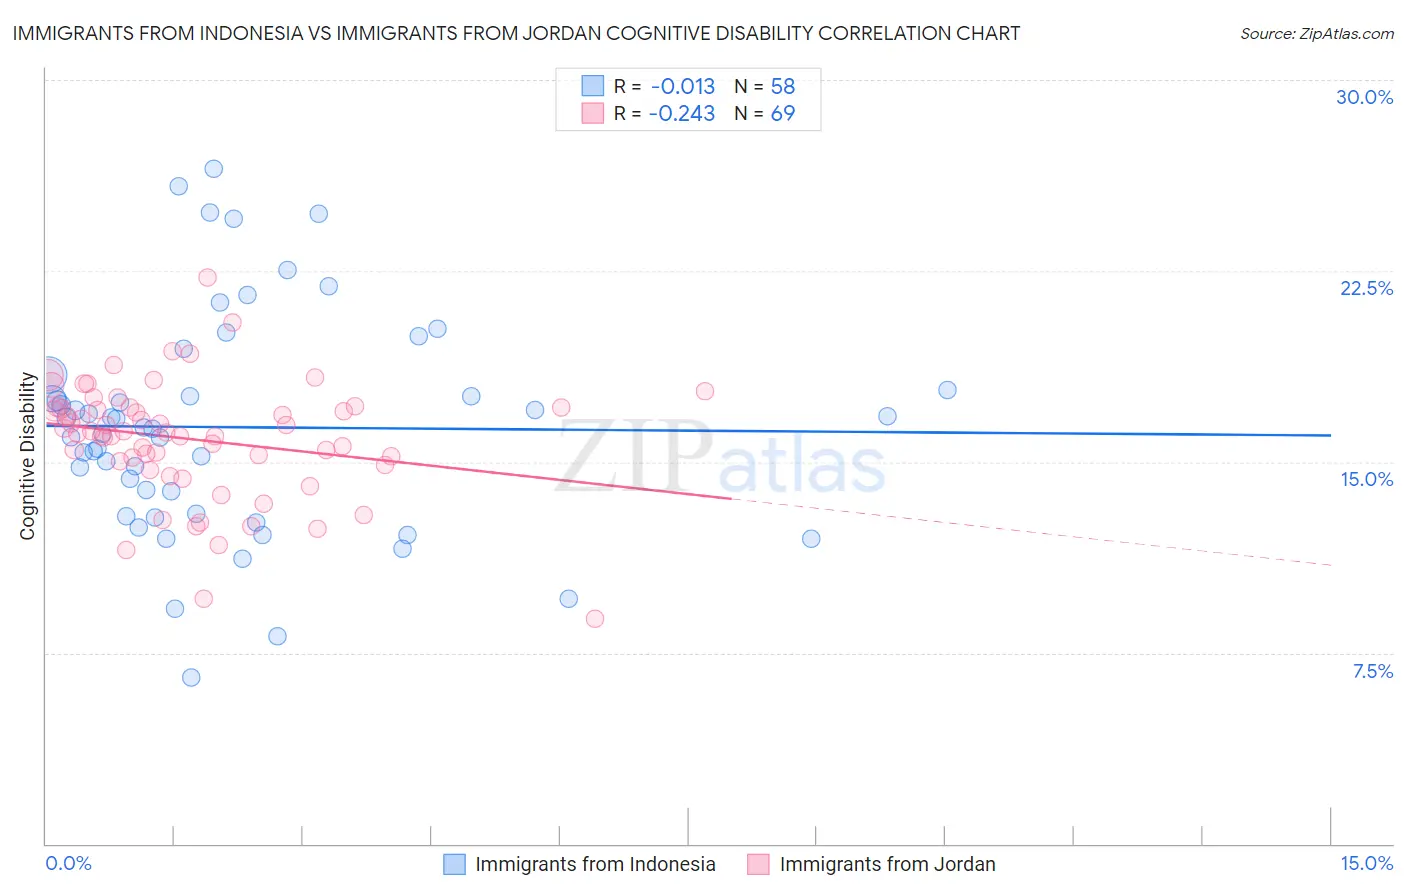
Immigrants from Indonesia vs Immigrants from Jordan Cognitive Disability Correlation Chart
The statistical analysis conducted on geographies consisting of 215,789,545 people shows no correlation between the proportion of Immigrants from Indonesia and percentage of population with cognitive disability in the United States with a correlation coefficient (R) of -0.013 and weighted average of 17.1%. Similarly, the statistical analysis conducted on geographies consisting of 181,275,613 people shows a weak negative correlation between the proportion of Immigrants from Jordan and percentage of population with cognitive disability in the United States with a correlation coefficient (R) of -0.243 and weighted average of 17.0%, a difference of 0.63%.
Cognitive Disability Correlation Summary
| Measurement | Immigrants from Indonesia | Immigrants from Jordan |
| Minimum | 6.5% | 8.8% |
| Maximum | 26.5% | 22.2% |
| Range | 20.0% | 13.4% |
| Mean | 16.4% | 15.9% |
| Median | 16.3% | 16.2% |
| Interquartile 25% (IQ1) | 12.9% | 15.0% |
| Interquartile 75% (IQ3) | 17.8% | 17.1% |
| Interquartile Range (IQR) | 4.9% | 2.2% |
| Standard Deviation (Sample) | 4.3% | 2.3% |
| Standard Deviation (Population) | 4.3% | 2.3% |
Demographics Similar to Immigrants from Indonesia and Immigrants from Jordan by Cognitive Disability
In terms of cognitive disability, the demographic groups most similar to Immigrants from Indonesia are Syrian (17.1%, a difference of 0.020%), Basque (17.1%, a difference of 0.15%), French Canadian (17.1%, a difference of 0.16%), Cypriot (17.1%, a difference of 0.16%), and Scotch-Irish (17.1%, a difference of 0.18%). Similarly, the demographic groups most similar to Immigrants from Jordan are Immigrants from Chile (17.0%, a difference of 0.020%), White/Caucasian (17.0%, a difference of 0.030%), Lebanese (17.0%, a difference of 0.060%), Israeli (17.0%, a difference of 0.080%), and Immigrants from Norway (17.0%, a difference of 0.090%).
| Demographics | Rating | Rank | Cognitive Disability |
| Whites/Caucasians | 92.1 /100 | #132 | Exceptional 17.0% |
| Immigrants | Jordan | 91.9 /100 | #133 | Exceptional 17.0% |
| Immigrants | Chile | 91.7 /100 | #134 | Exceptional 17.0% |
| Lebanese | 91.3 /100 | #135 | Exceptional 17.0% |
| Israelis | 91.0 /100 | #136 | Exceptional 17.0% |
| Immigrants | Norway | 90.9 /100 | #137 | Exceptional 17.0% |
| Welsh | 90.8 /100 | #138 | Exceptional 17.0% |
| French | 90.0 /100 | #139 | Excellent 17.0% |
| Chileans | 89.9 /100 | #140 | Excellent 17.0% |
| Aleuts | 89.9 /100 | #141 | Excellent 17.0% |
| Carpatho Rusyns | 89.6 /100 | #142 | Excellent 17.0% |
| British | 89.3 /100 | #143 | Excellent 17.0% |
| Immigrants | Brazil | 89.3 /100 | #144 | Excellent 17.0% |
| Immigrants | South Eastern Asia | 88.7 /100 | #145 | Excellent 17.0% |
| Costa Ricans | 88.0 /100 | #146 | Excellent 17.0% |
| Scotch-Irish | 85.9 /100 | #147 | Excellent 17.1% |
| French Canadians | 85.7 /100 | #148 | Excellent 17.1% |
| Cypriots | 85.7 /100 | #149 | Excellent 17.1% |
| Basques | 85.5 /100 | #150 | Excellent 17.1% |
| Syrians | 83.0 /100 | #151 | Excellent 17.1% |
| Immigrants | Indonesia | 82.7 /100 | #152 | Excellent 17.1% |