West Indian vs Aleut Median Female Earnings
COMPARE
West Indian
Aleut
Median Female Earnings
Median Female Earnings Comparison
West Indians
Aleuts
$40,317
MEDIAN FEMALE EARNINGS
78.4/ 100
METRIC RATING
152nd/ 347
METRIC RANK
$38,719
MEDIAN FEMALE EARNINGS
11.6/ 100
METRIC RATING
211th/ 347
METRIC RANK
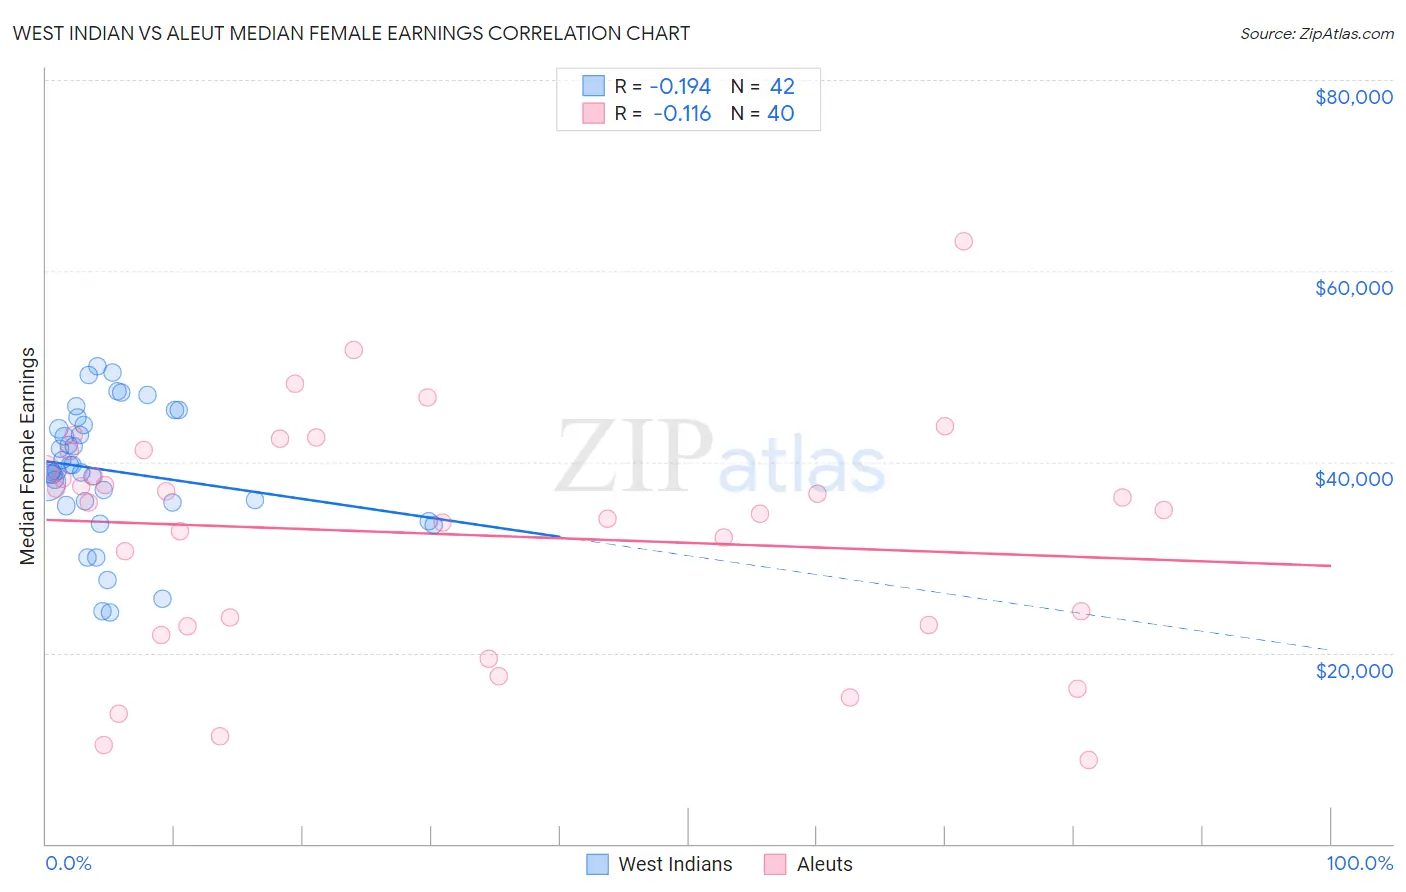
West Indian vs Aleut Median Female Earnings Correlation Chart
The statistical analysis conducted on geographies consisting of 253,995,323 people shows a poor negative correlation between the proportion of West Indians and median female earnings in the United States with a correlation coefficient (R) of -0.194 and weighted average of $40,317. Similarly, the statistical analysis conducted on geographies consisting of 61,761,178 people shows a poor negative correlation between the proportion of Aleuts and median female earnings in the United States with a correlation coefficient (R) of -0.116 and weighted average of $38,719, a difference of 4.1%.
Median Female Earnings Correlation Summary
| Measurement | West Indian | Aleut |
| Minimum | $24,276 | $8,750 |
| Maximum | $50,049 | $63,125 |
| Range | $25,773 | $54,375 |
| Mean | $39,058 | $32,459 |
| Median | $39,050 | $35,345 |
| Interquartile 25% (IQ1) | $35,688 | $22,835 |
| Interquartile 75% (IQ3) | $43,912 | $40,258 |
| Interquartile Range (IQR) | $8,224 | $17,423 |
| Standard Deviation (Sample) | $6,683 | $12,271 |
| Standard Deviation (Population) | $6,603 | $12,117 |
Similar Demographics by Median Female Earnings
Demographics Similar to West Indians by Median Female Earnings
In terms of median female earnings, the demographic groups most similar to West Indians are British West Indian ($40,299, a difference of 0.040%), Immigrants from Oceania ($40,297, a difference of 0.050%), Immigrants from Armenia ($40,340, a difference of 0.060%), Immigrants from Cameroon ($40,354, a difference of 0.090%), and Immigrants from Chile ($40,353, a difference of 0.090%).
| Demographics | Rating | Rank | Median Female Earnings |
| Brazilians | 83.6 /100 | #145 | Excellent $40,483 |
| Ghanaians | 82.1 /100 | #146 | Excellent $40,429 |
| Vietnamese | 80.4 /100 | #147 | Excellent $40,377 |
| Poles | 80.2 /100 | #148 | Excellent $40,371 |
| Immigrants | Cameroon | 79.7 /100 | #149 | Good $40,354 |
| Immigrants | Chile | 79.6 /100 | #150 | Good $40,353 |
| Immigrants | Armenia | 79.2 /100 | #151 | Good $40,340 |
| West Indians | 78.4 /100 | #152 | Good $40,317 |
| British West Indians | 77.7 /100 | #153 | Good $40,299 |
| Immigrants | Oceania | 77.6 /100 | #154 | Good $40,297 |
| Immigrants | Africa | 76.2 /100 | #155 | Good $40,257 |
| Peruvians | 75.3 /100 | #156 | Good $40,234 |
| Portuguese | 73.0 /100 | #157 | Good $40,177 |
| Immigrants | Senegal | 72.2 /100 | #158 | Good $40,157 |
| Immigrants | Vietnam | 72.0 /100 | #159 | Good $40,153 |
Demographics Similar to Aleuts by Median Female Earnings
In terms of median female earnings, the demographic groups most similar to Aleuts are Guamanian/Chamorro ($38,717, a difference of 0.010%), Czechoslovakian ($38,738, a difference of 0.050%), Jamaican ($38,670, a difference of 0.13%), Iraqi ($38,666, a difference of 0.14%), and Spaniard ($38,656, a difference of 0.16%).
| Demographics | Rating | Rank | Median Female Earnings |
| Immigrants | Uruguay | 17.3 /100 | #204 | Poor $38,945 |
| Immigrants | Colombia | 16.3 /100 | #205 | Poor $38,913 |
| Immigrants | Bosnia and Herzegovina | 15.6 /100 | #206 | Poor $38,886 |
| Immigrants | Cambodia | 14.2 /100 | #207 | Poor $38,833 |
| Immigrants | Thailand | 13.6 /100 | #208 | Poor $38,810 |
| Norwegians | 13.4 /100 | #209 | Poor $38,802 |
| Czechoslovakians | 12.0 /100 | #210 | Poor $38,738 |
| Aleuts | 11.6 /100 | #211 | Poor $38,719 |
| Guamanians/Chamorros | 11.5 /100 | #212 | Poor $38,717 |
| Jamaicans | 10.5 /100 | #213 | Poor $38,670 |
| Iraqis | 10.5 /100 | #214 | Poor $38,666 |
| Spaniards | 10.3 /100 | #215 | Poor $38,656 |
| Immigrants | Ecuador | 10.1 /100 | #216 | Poor $38,644 |
| Immigrants | Jamaica | 9.7 /100 | #217 | Tragic $38,625 |
| Cape Verdeans | 9.5 /100 | #218 | Tragic $38,614 |