Welsh vs Immigrants from Ecuador Female Disability
COMPARE
Welsh
Immigrants from Ecuador
Female Disability
Female Disability Comparison
Welsh
Immigrants from Ecuador
13.1%
FEMALE DISABILITY
0.0/ 100
METRIC RATING
282nd/ 347
METRIC RANK
11.9%
FEMALE DISABILITY
91.5/ 100
METRIC RATING
141st/ 347
METRIC RANK
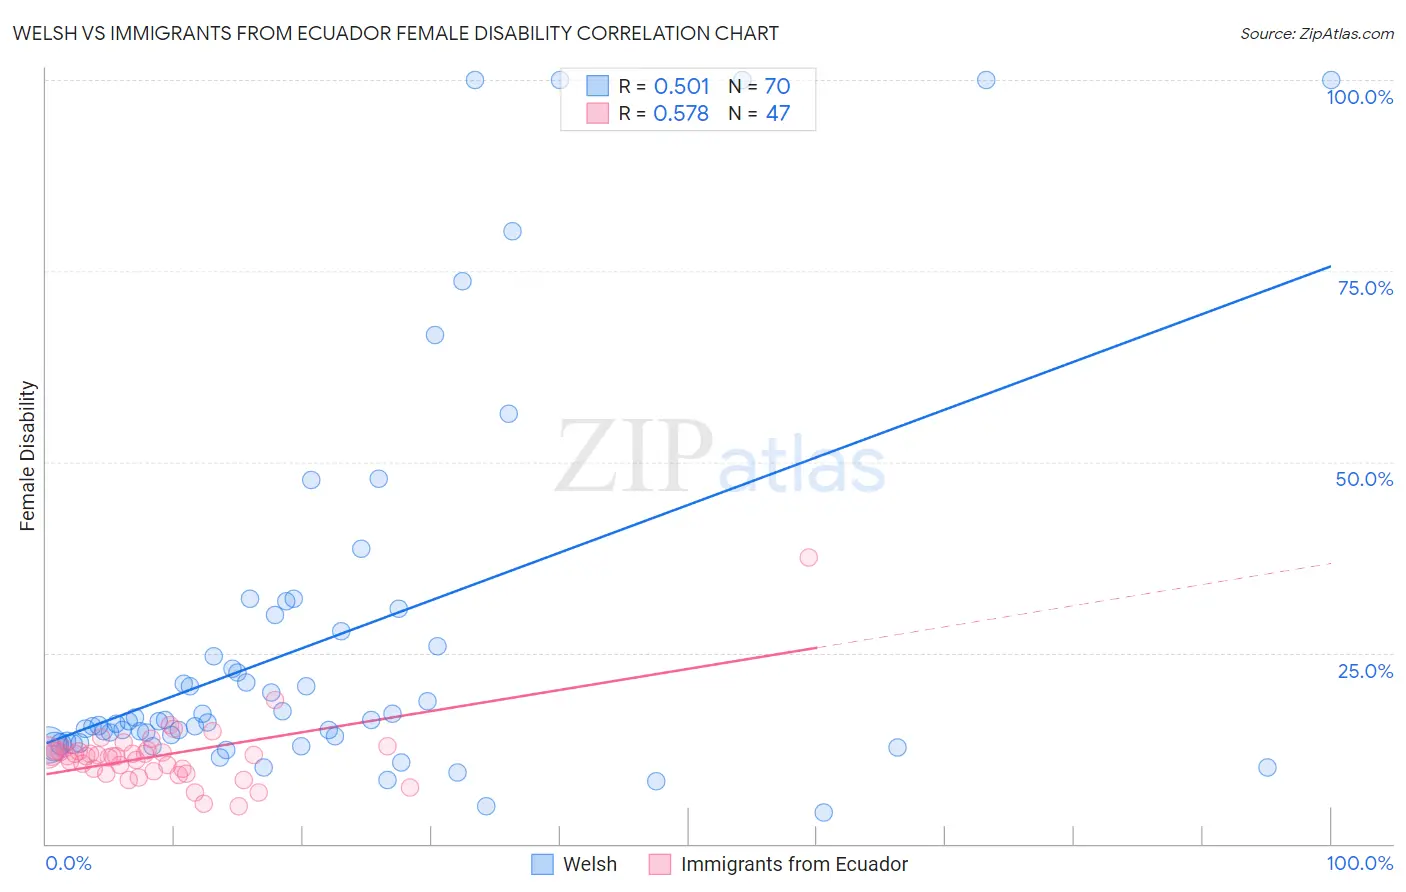
Welsh vs Immigrants from Ecuador Female Disability Correlation Chart
The statistical analysis conducted on geographies consisting of 528,453,595 people shows a substantial positive correlation between the proportion of Welsh and percentage of females with a disability in the United States with a correlation coefficient (R) of 0.501 and weighted average of 13.1%. Similarly, the statistical analysis conducted on geographies consisting of 270,971,790 people shows a substantial positive correlation between the proportion of Immigrants from Ecuador and percentage of females with a disability in the United States with a correlation coefficient (R) of 0.578 and weighted average of 11.9%, a difference of 9.6%.
Female Disability Correlation Summary
| Measurement | Welsh | Immigrants from Ecuador |
| Minimum | 4.2% | 4.9% |
| Maximum | 100.0% | 37.5% |
| Range | 95.8% | 32.6% |
| Mean | 26.8% | 11.6% |
| Median | 16.1% | 11.5% |
| Interquartile 25% (IQ1) | 13.2% | 9.5% |
| Interquartile 75% (IQ3) | 27.8% | 12.2% |
| Interquartile Range (IQR) | 14.7% | 2.6% |
| Standard Deviation (Sample) | 25.2% | 4.6% |
| Standard Deviation (Population) | 25.0% | 4.6% |
Similar Demographics by Female Disability
Demographics Similar to Welsh by Female Disability
In terms of female disability, the demographic groups most similar to Welsh are English (13.1%, a difference of 0.0%), U.S. Virgin Islander (13.1%, a difference of 0.080%), Irish (13.1%, a difference of 0.11%), Hmong (13.1%, a difference of 0.14%), and Bangladeshi (13.1%, a difference of 0.19%).
| Demographics | Rating | Rank | Female Disability |
| Cheyenne | 0.1 /100 | #275 | Tragic 13.0% |
| Immigrants | Dominica | 0.1 /100 | #276 | Tragic 13.0% |
| Spanish | 0.1 /100 | #277 | Tragic 13.0% |
| Scottish | 0.1 /100 | #278 | Tragic 13.0% |
| Arapaho | 0.1 /100 | #279 | Tragic 13.0% |
| Irish | 0.1 /100 | #280 | Tragic 13.1% |
| U.S. Virgin Islanders | 0.1 /100 | #281 | Tragic 13.1% |
| Welsh | 0.0 /100 | #282 | Tragic 13.1% |
| English | 0.0 /100 | #283 | Tragic 13.1% |
| Hmong | 0.0 /100 | #284 | Tragic 13.1% |
| Bangladeshis | 0.0 /100 | #285 | Tragic 13.1% |
| Fijians | 0.0 /100 | #286 | Tragic 13.1% |
| Yaqui | 0.0 /100 | #287 | Tragic 13.2% |
| Whites/Caucasians | 0.0 /100 | #288 | Tragic 13.2% |
| Tlingit-Haida | 0.0 /100 | #289 | Tragic 13.2% |
Demographics Similar to Immigrants from Ecuador by Female Disability
In terms of female disability, the demographic groups most similar to Immigrants from Ecuador are Romanian (11.9%, a difference of 0.020%), Immigrants from Africa (11.9%, a difference of 0.17%), Immigrants from Hungary (11.9%, a difference of 0.18%), Immigrants from Sudan (11.9%, a difference of 0.21%), and Ecuadorian (11.9%, a difference of 0.26%).
| Demographics | Rating | Rank | Female Disability |
| Immigrants | Nicaragua | 94.5 /100 | #134 | Exceptional 11.9% |
| Central Americans | 94.2 /100 | #135 | Exceptional 11.9% |
| Ugandans | 94.0 /100 | #136 | Exceptional 11.9% |
| Immigrants | Norway | 93.8 /100 | #137 | Exceptional 11.9% |
| Ecuadorians | 93.4 /100 | #138 | Exceptional 11.9% |
| Immigrants | Hungary | 92.8 /100 | #139 | Exceptional 11.9% |
| Romanians | 91.6 /100 | #140 | Exceptional 11.9% |
| Immigrants | Ecuador | 91.5 /100 | #141 | Exceptional 11.9% |
| Immigrants | Africa | 90.0 /100 | #142 | Excellent 11.9% |
| Immigrants | Sudan | 89.6 /100 | #143 | Excellent 11.9% |
| Immigrants | Austria | 87.9 /100 | #144 | Excellent 12.0% |
| Estonians | 87.8 /100 | #145 | Excellent 12.0% |
| Pakistanis | 84.6 /100 | #146 | Excellent 12.0% |
| Nigerians | 84.0 /100 | #147 | Excellent 12.0% |
| Immigrants | Kenya | 83.1 /100 | #148 | Excellent 12.0% |