Panamanian vs Immigrants from Ecuador Disability Age Under 5
COMPARE
Panamanian
Immigrants from Ecuador
Disability Age Under 5
Disability Age Under 5 Comparison
Panamanians
Immigrants from Ecuador
1.3%
DISABILITY AGE UNDER 5
7.1/ 100
METRIC RATING
225th/ 347
METRIC RANK
1.1%
DISABILITY AGE UNDER 5
98.6/ 100
METRIC RATING
70th/ 347
METRIC RANK
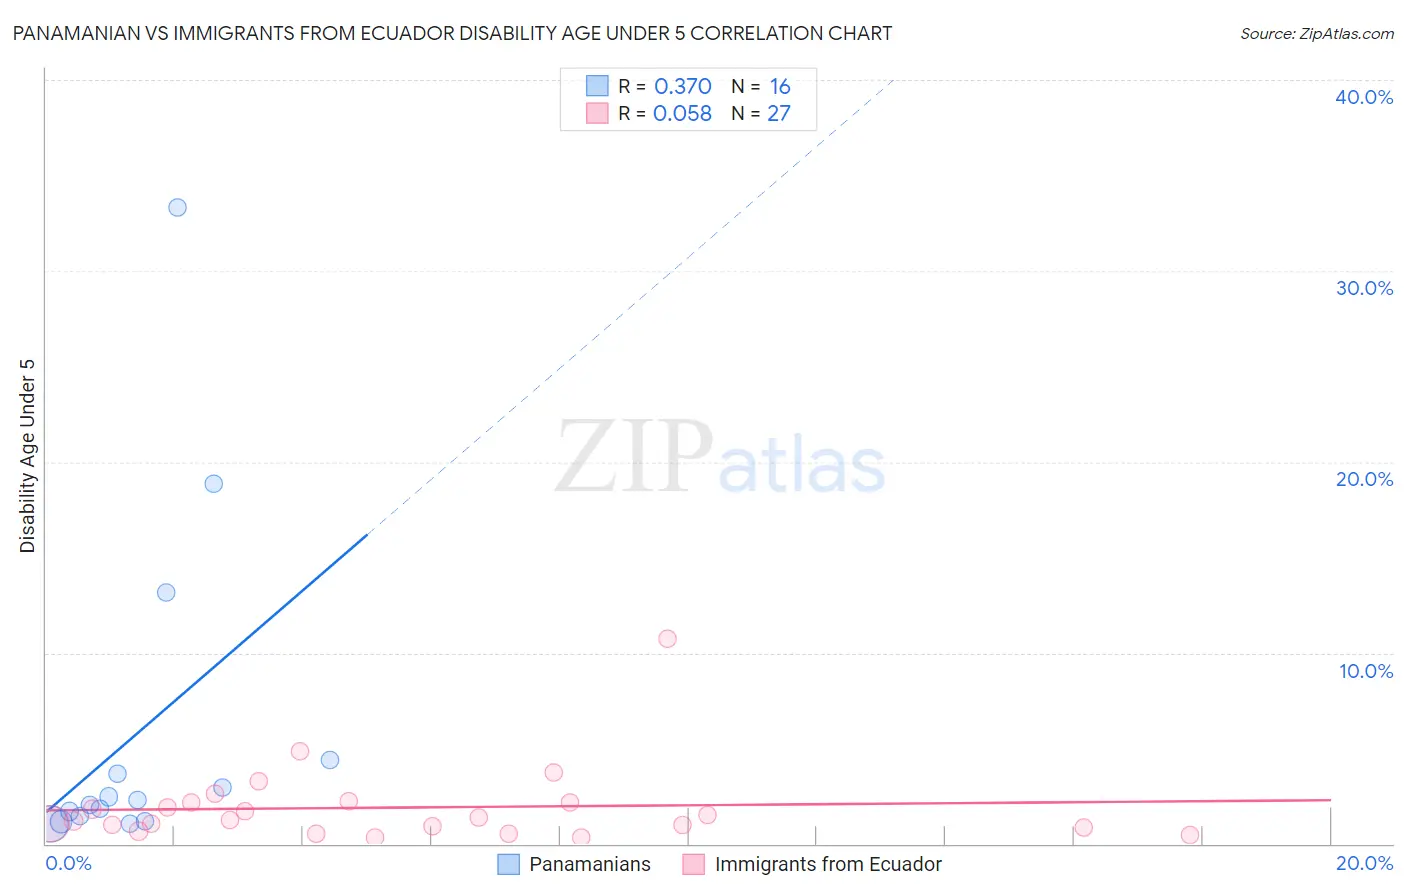
Panamanian vs Immigrants from Ecuador Disability Age Under 5 Correlation Chart
The statistical analysis conducted on geographies consisting of 171,907,057 people shows a mild positive correlation between the proportion of Panamanians and percentage of population with a disability under the age of 5 in the United States with a correlation coefficient (R) of 0.370 and weighted average of 1.3%. Similarly, the statistical analysis conducted on geographies consisting of 164,756,181 people shows a slight positive correlation between the proportion of Immigrants from Ecuador and percentage of population with a disability under the age of 5 in the United States with a correlation coefficient (R) of 0.058 and weighted average of 1.1%, a difference of 17.2%.
Disability Age Under 5 Correlation Summary
| Measurement | Panamanian | Immigrants from Ecuador |
| Minimum | 1.0% | 0.33% |
| Maximum | 33.3% | 10.7% |
| Range | 32.3% | 10.4% |
| Mean | 5.8% | 1.9% |
| Median | 2.2% | 1.2% |
| Interquartile 25% (IQ1) | 1.3% | 0.82% |
| Interquartile 75% (IQ3) | 4.0% | 2.2% |
| Interquartile Range (IQR) | 2.7% | 1.3% |
| Standard Deviation (Sample) | 8.9% | 2.1% |
| Standard Deviation (Population) | 8.6% | 2.0% |
Similar Demographics by Disability Age Under 5
Demographics Similar to Panamanians by Disability Age Under 5
In terms of disability age under 5, the demographic groups most similar to Panamanians are Bahamian (1.3%, a difference of 0.0%), Latvian (1.3%, a difference of 0.030%), Hispanic or Latino (1.3%, a difference of 0.19%), Taiwanese (1.3%, a difference of 0.34%), and Luxembourger (1.3%, a difference of 0.35%).
| Demographics | Rating | Rank | Disability Age Under 5 |
| Malaysians | 13.2 /100 | #218 | Poor 1.3% |
| Immigrants | Croatia | 11.2 /100 | #219 | Poor 1.3% |
| Serbians | 9.6 /100 | #220 | Tragic 1.3% |
| Sub-Saharan Africans | 8.3 /100 | #221 | Tragic 1.3% |
| Ukrainians | 8.3 /100 | #222 | Tragic 1.3% |
| Hispanics or Latinos | 7.7 /100 | #223 | Tragic 1.3% |
| Latvians | 7.1 /100 | #224 | Tragic 1.3% |
| Panamanians | 7.1 /100 | #225 | Tragic 1.3% |
| Bahamians | 7.1 /100 | #226 | Tragic 1.3% |
| Taiwanese | 6.1 /100 | #227 | Tragic 1.3% |
| Luxembourgers | 6.1 /100 | #228 | Tragic 1.3% |
| Immigrants | Costa Rica | 5.5 /100 | #229 | Tragic 1.3% |
| Lebanese | 5.3 /100 | #230 | Tragic 1.3% |
| Immigrants | Northern Europe | 4.7 /100 | #231 | Tragic 1.3% |
| French American Indians | 4.5 /100 | #232 | Tragic 1.3% |
Demographics Similar to Immigrants from Ecuador by Disability Age Under 5
In terms of disability age under 5, the demographic groups most similar to Immigrants from Ecuador are Trinidadian and Tobagonian (1.1%, a difference of 0.060%), Israeli (1.1%, a difference of 0.090%), South African (1.1%, a difference of 0.11%), Immigrants from Belize (1.1%, a difference of 0.15%), and Immigrants from Indonesia (1.1%, a difference of 0.22%).
| Demographics | Rating | Rank | Disability Age Under 5 |
| Immigrants | Vietnam | 99.1 /100 | #63 | Exceptional 1.1% |
| Egyptians | 98.9 /100 | #64 | Exceptional 1.1% |
| Immigrants | Korea | 98.8 /100 | #65 | Exceptional 1.1% |
| Immigrants | Indonesia | 98.7 /100 | #66 | Exceptional 1.1% |
| Immigrants | Belize | 98.7 /100 | #67 | Exceptional 1.1% |
| South Africans | 98.7 /100 | #68 | Exceptional 1.1% |
| Israelis | 98.7 /100 | #69 | Exceptional 1.1% |
| Immigrants | Ecuador | 98.6 /100 | #70 | Exceptional 1.1% |
| Trinidadians and Tobagonians | 98.6 /100 | #71 | Exceptional 1.1% |
| Burmese | 98.5 /100 | #72 | Exceptional 1.1% |
| Immigrants | Sri Lanka | 98.5 /100 | #73 | Exceptional 1.1% |
| Jordanians | 98.5 /100 | #74 | Exceptional 1.1% |
| Immigrants | Pakistan | 98.4 /100 | #75 | Exceptional 1.1% |
| Immigrants | Burma/Myanmar | 98.2 /100 | #76 | Exceptional 1.1% |
| Immigrants | Denmark | 98.1 /100 | #77 | Exceptional 1.1% |