Welsh vs Immigrants from Bulgaria Disability
COMPARE
Welsh
Immigrants from Bulgaria
Disability
Disability Comparison
Welsh
Immigrants from Bulgaria
12.9%
DISABILITY
0.0/ 100
METRIC RATING
284th/ 347
METRIC RANK
10.9%
DISABILITY
99.7/ 100
METRIC RATING
61st/ 347
METRIC RANK
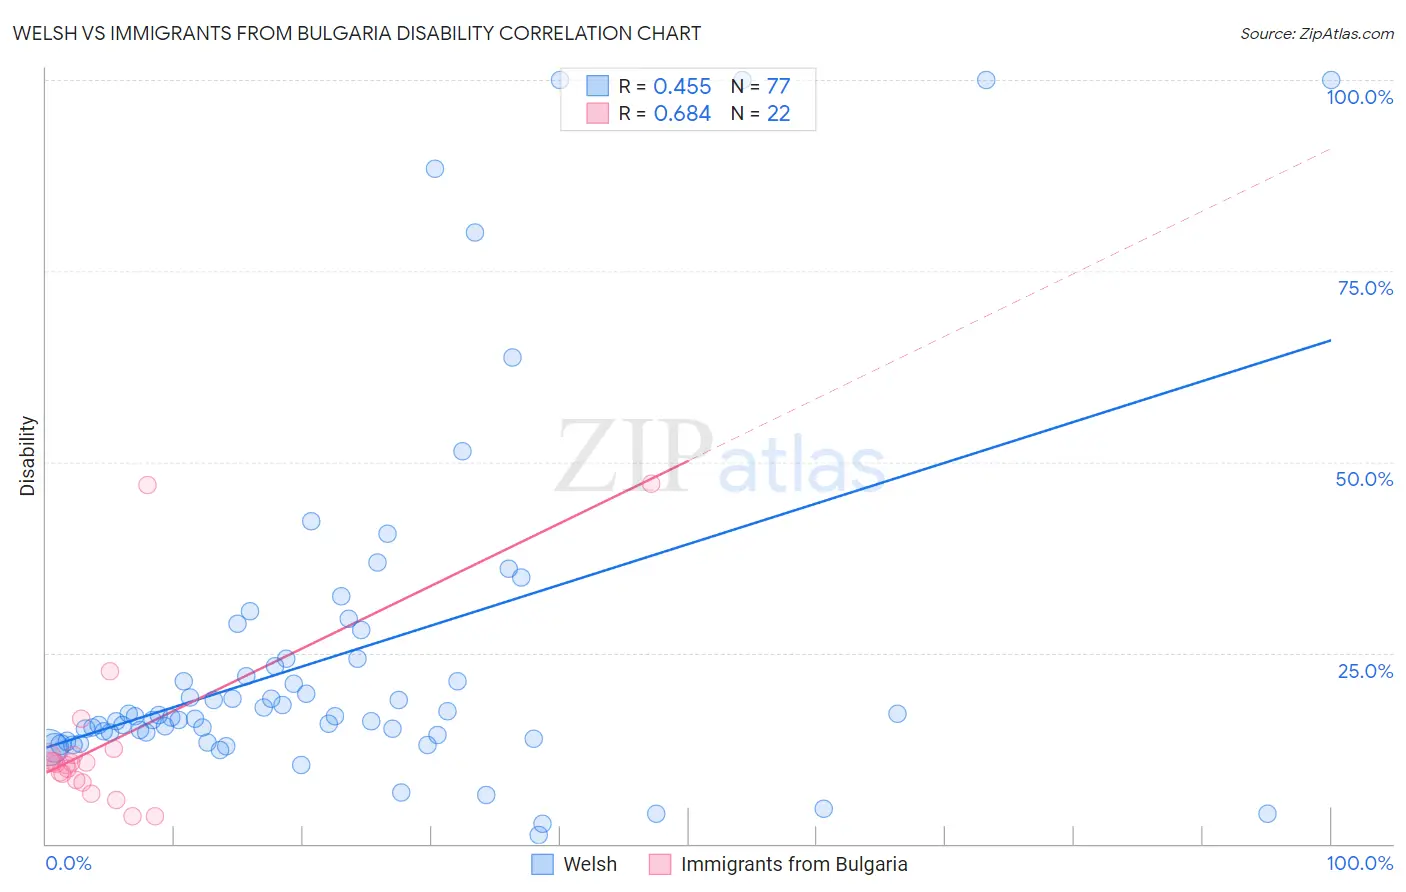
Welsh vs Immigrants from Bulgaria Disability Correlation Chart
The statistical analysis conducted on geographies consisting of 528,530,777 people shows a moderate positive correlation between the proportion of Welsh and percentage of population with a disability in the United States with a correlation coefficient (R) of 0.455 and weighted average of 12.9%. Similarly, the statistical analysis conducted on geographies consisting of 172,550,622 people shows a significant positive correlation between the proportion of Immigrants from Bulgaria and percentage of population with a disability in the United States with a correlation coefficient (R) of 0.684 and weighted average of 10.9%, a difference of 17.9%.
Disability Correlation Summary
| Measurement | Welsh | Immigrants from Bulgaria |
| Minimum | 1.2% | 3.6% |
| Maximum | 100.0% | 47.1% |
| Range | 98.8% | 43.5% |
| Mean | 24.8% | 13.5% |
| Median | 16.7% | 10.5% |
| Interquartile 25% (IQ1) | 14.0% | 8.3% |
| Interquartile 75% (IQ3) | 24.2% | 11.7% |
| Interquartile Range (IQR) | 10.1% | 3.4% |
| Standard Deviation (Sample) | 23.0% | 11.6% |
| Standard Deviation (Population) | 22.8% | 11.3% |
Similar Demographics by Disability
Demographics Similar to Welsh by Disability
In terms of disability, the demographic groups most similar to Welsh are Crow (12.9%, a difference of 0.010%), Irish (12.9%, a difference of 0.19%), Scottish (12.9%, a difference of 0.22%), Immigrants from Portugal (12.9%, a difference of 0.36%), and English (13.0%, a difference of 0.39%).
| Demographics | Rating | Rank | Disability |
| Dutch | 0.0 /100 | #277 | Tragic 12.8% |
| Germans | 0.0 /100 | #278 | Tragic 12.8% |
| Fijians | 0.0 /100 | #279 | Tragic 12.8% |
| Spanish | 0.0 /100 | #280 | Tragic 12.8% |
| Immigrants | Portugal | 0.0 /100 | #281 | Tragic 12.9% |
| Scottish | 0.0 /100 | #282 | Tragic 12.9% |
| Irish | 0.0 /100 | #283 | Tragic 12.9% |
| Welsh | 0.0 /100 | #284 | Tragic 12.9% |
| Crow | 0.0 /100 | #285 | Tragic 12.9% |
| English | 0.0 /100 | #286 | Tragic 13.0% |
| Africans | 0.0 /100 | #287 | Tragic 13.0% |
| Whites/Caucasians | 0.0 /100 | #288 | Tragic 13.0% |
| Slovaks | 0.0 /100 | #289 | Tragic 13.0% |
| Cheyenne | 0.0 /100 | #290 | Tragic 13.0% |
| Yaqui | 0.0 /100 | #291 | Tragic 13.1% |
Demographics Similar to Immigrants from Bulgaria by Disability
In terms of disability, the demographic groups most similar to Immigrants from Bulgaria are Immigrants from Northern Africa (10.9%, a difference of 0.040%), Zimbabwean (10.9%, a difference of 0.060%), Immigrants from Eritrea (11.0%, a difference of 0.060%), Immigrants from Colombia (10.9%, a difference of 0.15%), and Immigrants from South America (10.9%, a difference of 0.24%).
| Demographics | Rating | Rank | Disability |
| Jordanians | 99.8 /100 | #54 | Exceptional 10.9% |
| Immigrants | El Salvador | 99.8 /100 | #55 | Exceptional 10.9% |
| Immigrants | Lithuania | 99.8 /100 | #56 | Exceptional 10.9% |
| Salvadorans | 99.8 /100 | #57 | Exceptional 10.9% |
| Immigrants | South America | 99.8 /100 | #58 | Exceptional 10.9% |
| Immigrants | Colombia | 99.7 /100 | #59 | Exceptional 10.9% |
| Zimbabweans | 99.7 /100 | #60 | Exceptional 10.9% |
| Immigrants | Bulgaria | 99.7 /100 | #61 | Exceptional 10.9% |
| Immigrants | Northern Africa | 99.7 /100 | #62 | Exceptional 10.9% |
| Immigrants | Eritrea | 99.7 /100 | #63 | Exceptional 11.0% |
| Immigrants | Sweden | 99.6 /100 | #64 | Exceptional 11.0% |
| Bulgarians | 99.6 /100 | #65 | Exceptional 11.0% |
| Laotians | 99.6 /100 | #66 | Exceptional 11.0% |
| Colombians | 99.6 /100 | #67 | Exceptional 11.0% |
| Immigrants | Afghanistan | 99.6 /100 | #68 | Exceptional 11.0% |