Welsh vs Guatemalan Disability
COMPARE
Welsh
Guatemalan
Disability
Disability Comparison
Welsh
Guatemalans
12.9%
DISABILITY
0.0/ 100
METRIC RATING
284th/ 347
METRIC RANK
11.6%
DISABILITY
65.1/ 100
METRIC RATING
159th/ 347
METRIC RANK
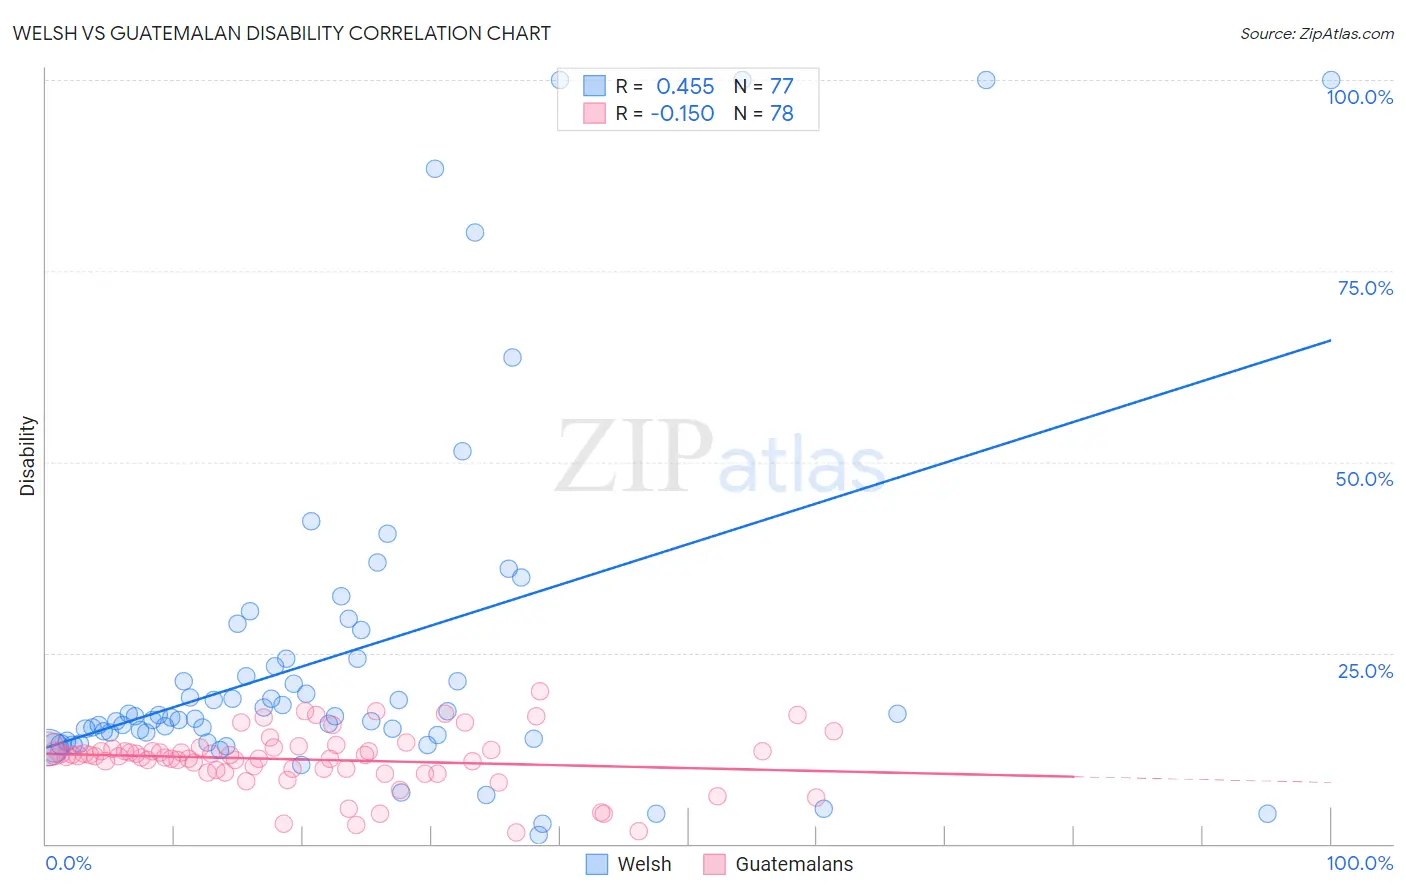
Welsh vs Guatemalan Disability Correlation Chart
The statistical analysis conducted on geographies consisting of 528,530,777 people shows a moderate positive correlation between the proportion of Welsh and percentage of population with a disability in the United States with a correlation coefficient (R) of 0.455 and weighted average of 12.9%. Similarly, the statistical analysis conducted on geographies consisting of 409,499,513 people shows a poor negative correlation between the proportion of Guatemalans and percentage of population with a disability in the United States with a correlation coefficient (R) of -0.150 and weighted average of 11.6%, a difference of 11.1%.
Disability Correlation Summary
| Measurement | Welsh | Guatemalan |
| Minimum | 1.2% | 1.4% |
| Maximum | 100.0% | 20.0% |
| Range | 98.8% | 18.6% |
| Mean | 24.8% | 11.0% |
| Median | 16.7% | 11.5% |
| Interquartile 25% (IQ1) | 14.0% | 9.6% |
| Interquartile 75% (IQ3) | 24.2% | 12.4% |
| Interquartile Range (IQR) | 10.1% | 2.7% |
| Standard Deviation (Sample) | 23.0% | 3.7% |
| Standard Deviation (Population) | 22.8% | 3.7% |
Similar Demographics by Disability
Demographics Similar to Welsh by Disability
In terms of disability, the demographic groups most similar to Welsh are Crow (12.9%, a difference of 0.010%), Irish (12.9%, a difference of 0.19%), Scottish (12.9%, a difference of 0.22%), Immigrants from Portugal (12.9%, a difference of 0.36%), and English (13.0%, a difference of 0.39%).
| Demographics | Rating | Rank | Disability |
| Dutch | 0.0 /100 | #277 | Tragic 12.8% |
| Germans | 0.0 /100 | #278 | Tragic 12.8% |
| Fijians | 0.0 /100 | #279 | Tragic 12.8% |
| Spanish | 0.0 /100 | #280 | Tragic 12.8% |
| Immigrants | Portugal | 0.0 /100 | #281 | Tragic 12.9% |
| Scottish | 0.0 /100 | #282 | Tragic 12.9% |
| Irish | 0.0 /100 | #283 | Tragic 12.9% |
| Welsh | 0.0 /100 | #284 | Tragic 12.9% |
| Crow | 0.0 /100 | #285 | Tragic 12.9% |
| English | 0.0 /100 | #286 | Tragic 13.0% |
| Africans | 0.0 /100 | #287 | Tragic 13.0% |
| Whites/Caucasians | 0.0 /100 | #288 | Tragic 13.0% |
| Slovaks | 0.0 /100 | #289 | Tragic 13.0% |
| Cheyenne | 0.0 /100 | #290 | Tragic 13.0% |
| Yaqui | 0.0 /100 | #291 | Tragic 13.1% |
Demographics Similar to Guatemalans by Disability
In terms of disability, the demographic groups most similar to Guatemalans are Armenian (11.6%, a difference of 0.040%), Immigrants from Barbados (11.6%, a difference of 0.040%), Immigrants from Cuba (11.6%, a difference of 0.11%), Immigrants from Middle Africa (11.6%, a difference of 0.22%), and Immigrants from Fiji (11.6%, a difference of 0.23%).
| Demographics | Rating | Rank | Disability |
| Immigrants | Moldova | 72.0 /100 | #152 | Good 11.6% |
| Immigrants | Ghana | 71.2 /100 | #153 | Good 11.6% |
| Immigrants | Guatemala | 71.1 /100 | #154 | Good 11.6% |
| Immigrants | Netherlands | 69.8 /100 | #155 | Good 11.6% |
| Immigrants | Fiji | 69.5 /100 | #156 | Good 11.6% |
| Immigrants | Middle Africa | 69.5 /100 | #157 | Good 11.6% |
| Armenians | 65.9 /100 | #158 | Good 11.6% |
| Guatemalans | 65.1 /100 | #159 | Good 11.6% |
| Immigrants | Barbados | 64.2 /100 | #160 | Good 11.6% |
| Immigrants | Cuba | 62.8 /100 | #161 | Good 11.6% |
| Immigrants | Haiti | 59.2 /100 | #162 | Average 11.7% |
| Immigrants | Trinidad and Tobago | 58.9 /100 | #163 | Average 11.7% |
| Syrians | 58.5 /100 | #164 | Average 11.7% |
| Cubans | 56.7 /100 | #165 | Average 11.7% |
| Pakistanis | 54.7 /100 | #166 | Average 11.7% |