Indian (Asian) vs Immigrants from Bulgaria Disability
COMPARE
Indian (Asian)
Immigrants from Bulgaria
Disability
Disability Comparison
Indians (Asian)
Immigrants from Bulgaria
10.3%
DISABILITY
100.0/ 100
METRIC RATING
16th/ 347
METRIC RANK
10.9%
DISABILITY
99.7/ 100
METRIC RATING
61st/ 347
METRIC RANK
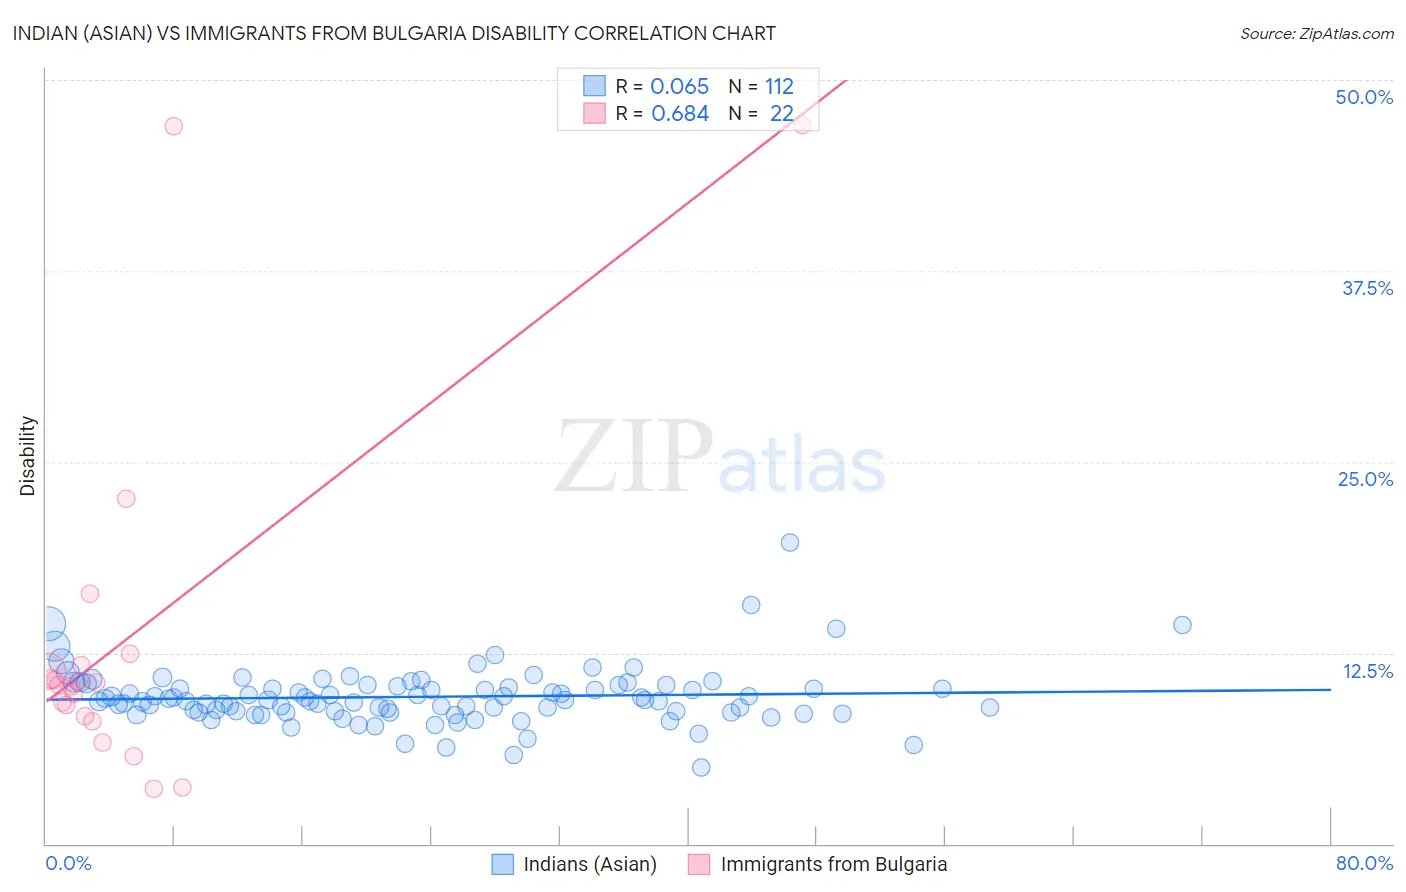
Indian (Asian) vs Immigrants from Bulgaria Disability Correlation Chart
The statistical analysis conducted on geographies consisting of 495,278,900 people shows a slight positive correlation between the proportion of Indians (Asian) and percentage of population with a disability in the United States with a correlation coefficient (R) of 0.065 and weighted average of 10.3%. Similarly, the statistical analysis conducted on geographies consisting of 172,550,622 people shows a significant positive correlation between the proportion of Immigrants from Bulgaria and percentage of population with a disability in the United States with a correlation coefficient (R) of 0.684 and weighted average of 10.9%, a difference of 6.7%.
Disability Correlation Summary
| Measurement | Indian (Asian) | Immigrants from Bulgaria |
| Minimum | 5.0% | 3.6% |
| Maximum | 19.7% | 47.1% |
| Range | 14.7% | 43.5% |
| Mean | 9.6% | 13.5% |
| Median | 9.4% | 10.5% |
| Interquartile 25% (IQ1) | 8.6% | 8.3% |
| Interquartile 75% (IQ3) | 10.3% | 11.7% |
| Interquartile Range (IQR) | 1.7% | 3.4% |
| Standard Deviation (Sample) | 1.9% | 11.6% |
| Standard Deviation (Population) | 1.9% | 11.3% |
Similar Demographics by Disability
Demographics Similar to Indians (Asian) by Disability
In terms of disability, the demographic groups most similar to Indians (Asian) are Okinawan (10.3%, a difference of 0.070%), Immigrants from Iran (10.3%, a difference of 0.070%), Immigrants from Korea (10.2%, a difference of 0.37%), Immigrants from Eastern Asia (10.2%, a difference of 0.98%), and Burmese (10.4%, a difference of 1.1%).
| Demographics | Rating | Rank | Disability |
| Immigrants | Hong Kong | 100.0 /100 | #9 | Exceptional 10.0% |
| Immigrants | China | 100.0 /100 | #10 | Exceptional 10.1% |
| Iranians | 100.0 /100 | #11 | Exceptional 10.1% |
| Immigrants | Israel | 100.0 /100 | #12 | Exceptional 10.1% |
| Immigrants | Eastern Asia | 100.0 /100 | #13 | Exceptional 10.2% |
| Immigrants | Korea | 100.0 /100 | #14 | Exceptional 10.2% |
| Okinawans | 100.0 /100 | #15 | Exceptional 10.3% |
| Indians (Asian) | 100.0 /100 | #16 | Exceptional 10.3% |
| Immigrants | Iran | 100.0 /100 | #17 | Exceptional 10.3% |
| Burmese | 100.0 /100 | #18 | Exceptional 10.4% |
| Immigrants | Pakistan | 100.0 /100 | #19 | Exceptional 10.4% |
| Immigrants | Venezuela | 100.0 /100 | #20 | Exceptional 10.4% |
| Asians | 100.0 /100 | #21 | Exceptional 10.4% |
| Immigrants | Sri Lanka | 100.0 /100 | #22 | Exceptional 10.5% |
| Immigrants | Asia | 100.0 /100 | #23 | Exceptional 10.5% |
Demographics Similar to Immigrants from Bulgaria by Disability
In terms of disability, the demographic groups most similar to Immigrants from Bulgaria are Immigrants from Northern Africa (10.9%, a difference of 0.040%), Zimbabwean (10.9%, a difference of 0.060%), Immigrants from Eritrea (11.0%, a difference of 0.060%), Immigrants from Colombia (10.9%, a difference of 0.15%), and Immigrants from South America (10.9%, a difference of 0.24%).
| Demographics | Rating | Rank | Disability |
| Jordanians | 99.8 /100 | #54 | Exceptional 10.9% |
| Immigrants | El Salvador | 99.8 /100 | #55 | Exceptional 10.9% |
| Immigrants | Lithuania | 99.8 /100 | #56 | Exceptional 10.9% |
| Salvadorans | 99.8 /100 | #57 | Exceptional 10.9% |
| Immigrants | South America | 99.8 /100 | #58 | Exceptional 10.9% |
| Immigrants | Colombia | 99.7 /100 | #59 | Exceptional 10.9% |
| Zimbabweans | 99.7 /100 | #60 | Exceptional 10.9% |
| Immigrants | Bulgaria | 99.7 /100 | #61 | Exceptional 10.9% |
| Immigrants | Northern Africa | 99.7 /100 | #62 | Exceptional 10.9% |
| Immigrants | Eritrea | 99.7 /100 | #63 | Exceptional 11.0% |
| Immigrants | Sweden | 99.6 /100 | #64 | Exceptional 11.0% |
| Bulgarians | 99.6 /100 | #65 | Exceptional 11.0% |
| Laotians | 99.6 /100 | #66 | Exceptional 11.0% |
| Colombians | 99.6 /100 | #67 | Exceptional 11.0% |
| Immigrants | Afghanistan | 99.6 /100 | #68 | Exceptional 11.0% |