Sudanese vs Immigrants from Bulgaria Disability
COMPARE
Sudanese
Immigrants from Bulgaria
Disability
Disability Comparison
Sudanese
Immigrants from Bulgaria
11.5%
DISABILITY
77.1/ 100
METRIC RATING
148th/ 347
METRIC RANK
10.9%
DISABILITY
99.7/ 100
METRIC RATING
61st/ 347
METRIC RANK
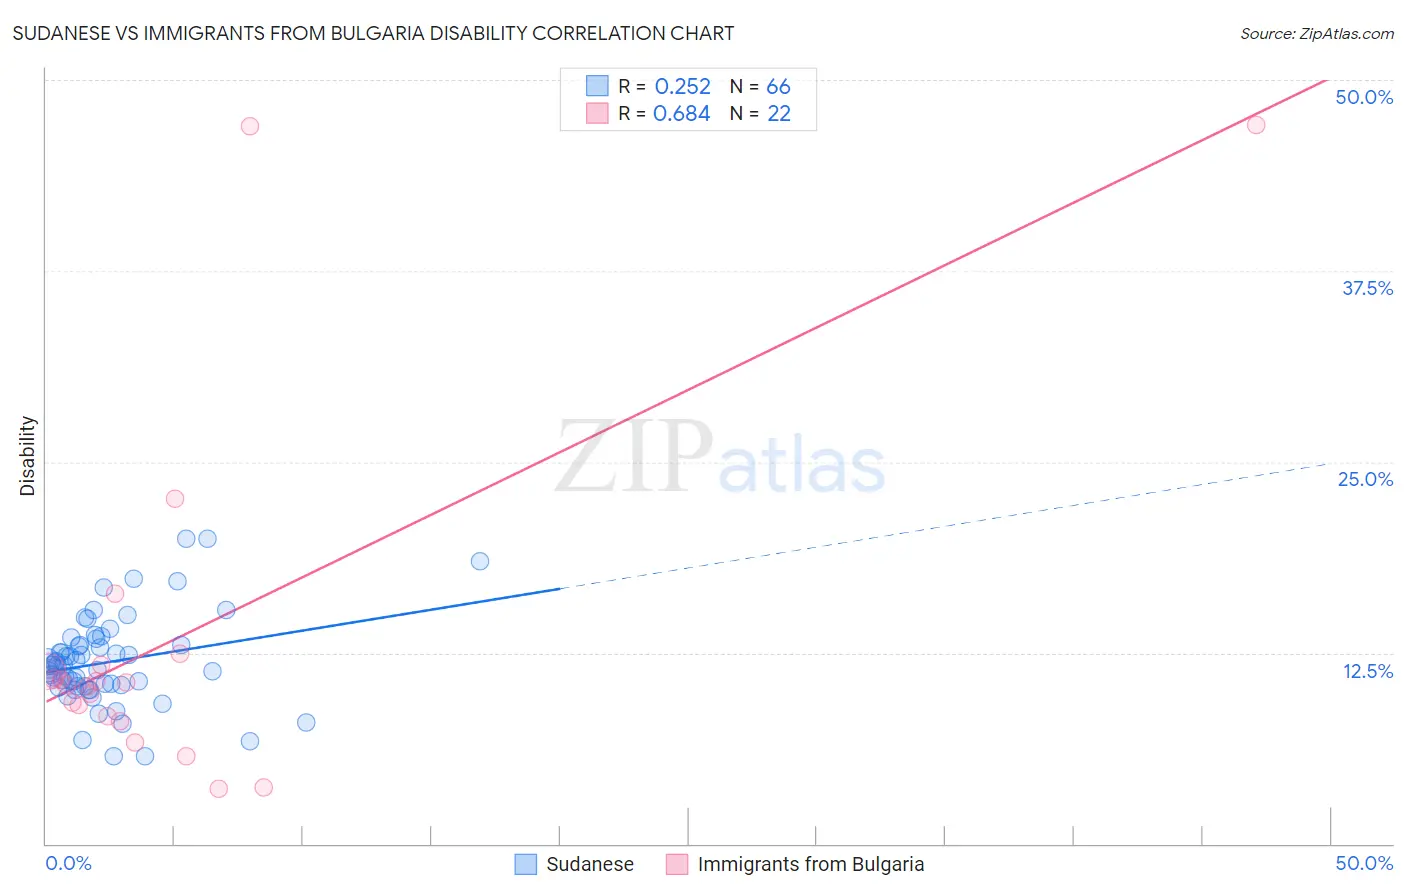
Sudanese vs Immigrants from Bulgaria Disability Correlation Chart
The statistical analysis conducted on geographies consisting of 110,141,954 people shows a weak positive correlation between the proportion of Sudanese and percentage of population with a disability in the United States with a correlation coefficient (R) of 0.252 and weighted average of 11.5%. Similarly, the statistical analysis conducted on geographies consisting of 172,550,622 people shows a significant positive correlation between the proportion of Immigrants from Bulgaria and percentage of population with a disability in the United States with a correlation coefficient (R) of 0.684 and weighted average of 10.9%, a difference of 5.5%.
Disability Correlation Summary
| Measurement | Sudanese | Immigrants from Bulgaria |
| Minimum | 5.7% | 3.6% |
| Maximum | 20.0% | 47.1% |
| Range | 14.3% | 43.5% |
| Mean | 11.9% | 13.5% |
| Median | 11.7% | 10.5% |
| Interquartile 25% (IQ1) | 10.3% | 8.3% |
| Interquartile 75% (IQ3) | 13.0% | 11.7% |
| Interquartile Range (IQR) | 2.7% | 3.4% |
| Standard Deviation (Sample) | 2.9% | 11.6% |
| Standard Deviation (Population) | 2.9% | 11.3% |
Similar Demographics by Disability
Demographics Similar to Sudanese by Disability
In terms of disability, the demographic groups most similar to Sudanese are Immigrants from Ukraine (11.5%, a difference of 0.030%), Immigrants from Hungary (11.5%, a difference of 0.12%), Immigrants from Norway (11.6%, a difference of 0.24%), Romanian (11.6%, a difference of 0.27%), and Nigerian (11.5%, a difference of 0.29%).
| Demographics | Rating | Rank | Disability |
| Immigrants | Grenada | 86.1 /100 | #141 | Excellent 11.5% |
| Immigrants | Sudan | 85.3 /100 | #142 | Excellent 11.5% |
| Moroccans | 83.3 /100 | #143 | Excellent 11.5% |
| Australians | 82.5 /100 | #144 | Excellent 11.5% |
| Nigerians | 81.3 /100 | #145 | Excellent 11.5% |
| Immigrants | Hungary | 79.0 /100 | #146 | Good 11.5% |
| Immigrants | Ukraine | 77.6 /100 | #147 | Good 11.5% |
| Sudanese | 77.1 /100 | #148 | Good 11.5% |
| Immigrants | Norway | 73.2 /100 | #149 | Good 11.6% |
| Romanians | 72.7 /100 | #150 | Good 11.6% |
| Immigrants | Kenya | 72.1 /100 | #151 | Good 11.6% |
| Immigrants | Moldova | 72.0 /100 | #152 | Good 11.6% |
| Immigrants | Ghana | 71.2 /100 | #153 | Good 11.6% |
| Immigrants | Guatemala | 71.1 /100 | #154 | Good 11.6% |
| Immigrants | Netherlands | 69.8 /100 | #155 | Good 11.6% |
Demographics Similar to Immigrants from Bulgaria by Disability
In terms of disability, the demographic groups most similar to Immigrants from Bulgaria are Immigrants from Northern Africa (10.9%, a difference of 0.040%), Zimbabwean (10.9%, a difference of 0.060%), Immigrants from Eritrea (11.0%, a difference of 0.060%), Immigrants from Colombia (10.9%, a difference of 0.15%), and Immigrants from South America (10.9%, a difference of 0.24%).
| Demographics | Rating | Rank | Disability |
| Jordanians | 99.8 /100 | #54 | Exceptional 10.9% |
| Immigrants | El Salvador | 99.8 /100 | #55 | Exceptional 10.9% |
| Immigrants | Lithuania | 99.8 /100 | #56 | Exceptional 10.9% |
| Salvadorans | 99.8 /100 | #57 | Exceptional 10.9% |
| Immigrants | South America | 99.8 /100 | #58 | Exceptional 10.9% |
| Immigrants | Colombia | 99.7 /100 | #59 | Exceptional 10.9% |
| Zimbabweans | 99.7 /100 | #60 | Exceptional 10.9% |
| Immigrants | Bulgaria | 99.7 /100 | #61 | Exceptional 10.9% |
| Immigrants | Northern Africa | 99.7 /100 | #62 | Exceptional 10.9% |
| Immigrants | Eritrea | 99.7 /100 | #63 | Exceptional 11.0% |
| Immigrants | Sweden | 99.6 /100 | #64 | Exceptional 11.0% |
| Bulgarians | 99.6 /100 | #65 | Exceptional 11.0% |
| Laotians | 99.6 /100 | #66 | Exceptional 11.0% |
| Colombians | 99.6 /100 | #67 | Exceptional 11.0% |
| Immigrants | Afghanistan | 99.6 /100 | #68 | Exceptional 11.0% |