Welsh vs Immigrants from Bulgaria No Vehicles in Household
COMPARE
Welsh
Immigrants from Bulgaria
No Vehicles in Household
No Vehicles in Household Comparison
Welsh
Immigrants from Bulgaria
7.2%
NO VEHICLES IN HOUSEHOLD
100.0/ 100
METRIC RATING
17th/ 347
METRIC RANK
10.5%
NO VEHICLES IN HOUSEHOLD
43.8/ 100
METRIC RATING
182nd/ 347
METRIC RANK
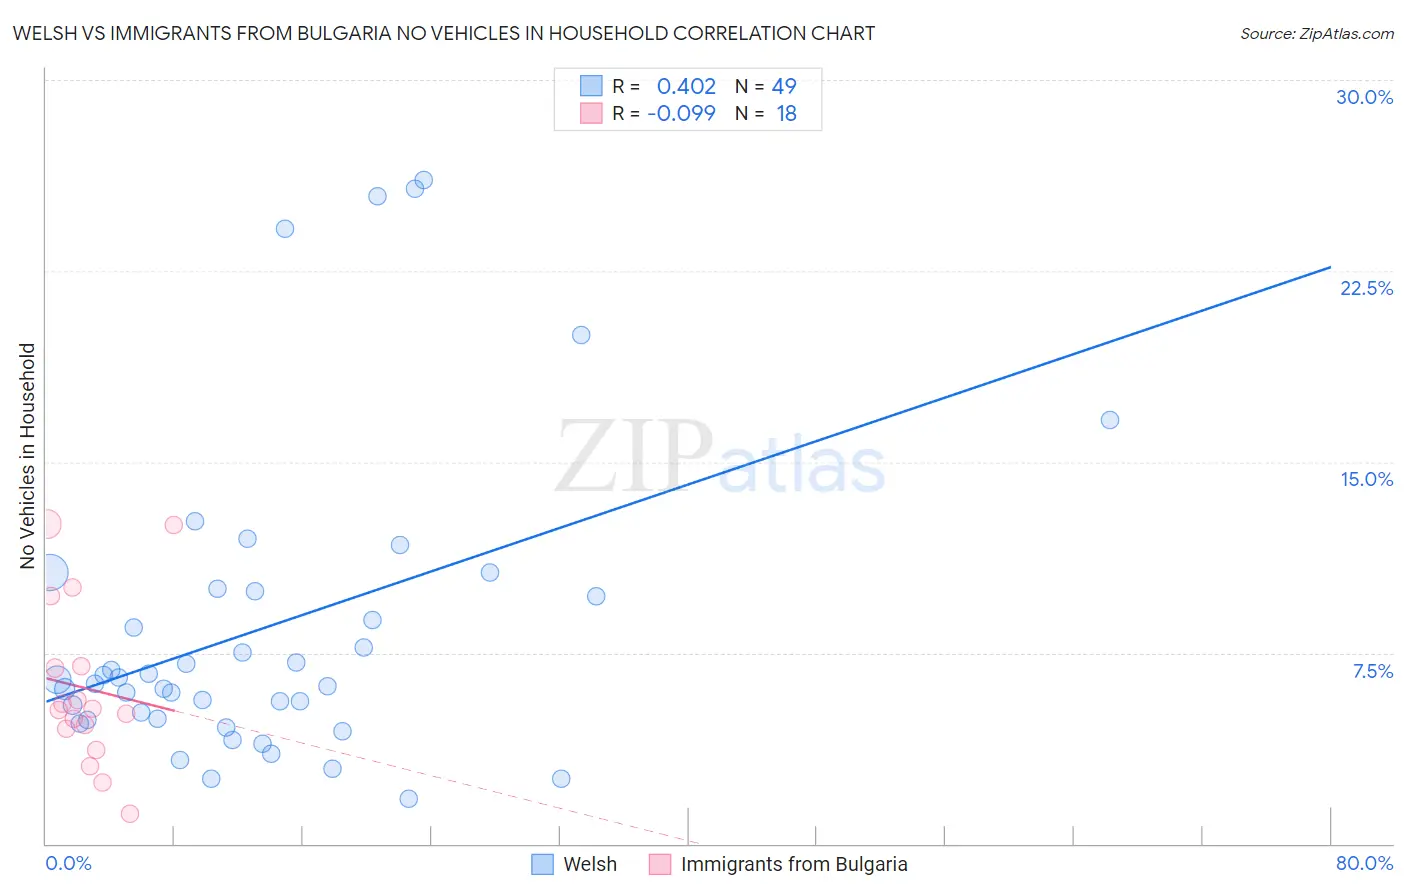
Welsh vs Immigrants from Bulgaria No Vehicles in Household Correlation Chart
The statistical analysis conducted on geographies consisting of 524,885,913 people shows a moderate positive correlation between the proportion of Welsh and percentage of households with no vehicle available in the United States with a correlation coefficient (R) of 0.402 and weighted average of 7.2%. Similarly, the statistical analysis conducted on geographies consisting of 172,447,526 people shows a slight negative correlation between the proportion of Immigrants from Bulgaria and percentage of households with no vehicle available in the United States with a correlation coefficient (R) of -0.099 and weighted average of 10.5%, a difference of 46.6%.
No Vehicles in Household Correlation Summary
| Measurement | Welsh | Immigrants from Bulgaria |
| Minimum | 1.8% | 1.2% |
| Maximum | 26.1% | 12.6% |
| Range | 24.3% | 11.4% |
| Mean | 8.5% | 6.1% |
| Median | 6.5% | 5.3% |
| Interquartile 25% (IQ1) | 4.9% | 4.5% |
| Interquartile 75% (IQ3) | 10.0% | 7.0% |
| Interquartile Range (IQR) | 5.1% | 2.5% |
| Standard Deviation (Sample) | 6.1% | 3.2% |
| Standard Deviation (Population) | 6.1% | 3.1% |
Similar Demographics by No Vehicles in Household
Demographics Similar to Welsh by No Vehicles in Household
In terms of no vehicles in household, the demographic groups most similar to Welsh are Tongan (7.2%, a difference of 0.21%), European (7.1%, a difference of 0.56%), White/Caucasian (7.0%, a difference of 1.7%), Mexican (7.0%, a difference of 1.9%), and Scandinavian (7.0%, a difference of 2.0%).
| Demographics | Rating | Rank | No Vehicles in Household |
| Dutch | 100.0 /100 | #10 | Exceptional 6.8% |
| Czechs | 100.0 /100 | #11 | Exceptional 6.9% |
| Assyrians/Chaldeans/Syriacs | 100.0 /100 | #12 | Exceptional 7.0% |
| Scandinavians | 100.0 /100 | #13 | Exceptional 7.0% |
| Mexicans | 100.0 /100 | #14 | Exceptional 7.0% |
| Whites/Caucasians | 100.0 /100 | #15 | Exceptional 7.0% |
| Europeans | 100.0 /100 | #16 | Exceptional 7.1% |
| Welsh | 100.0 /100 | #17 | Exceptional 7.2% |
| Tongans | 100.0 /100 | #18 | Exceptional 7.2% |
| Arapaho | 100.0 /100 | #19 | Exceptional 7.4% |
| Ottawa | 100.0 /100 | #20 | Exceptional 7.4% |
| Nepalese | 100.0 /100 | #21 | Exceptional 7.4% |
| Irish | 100.0 /100 | #22 | Exceptional 7.4% |
| French | 100.0 /100 | #23 | Exceptional 7.4% |
| Immigrants | Iraq | 100.0 /100 | #24 | Exceptional 7.5% |
Demographics Similar to Immigrants from Bulgaria by No Vehicles in Household
In terms of no vehicles in household, the demographic groups most similar to Immigrants from Bulgaria are Native/Alaskan (10.5%, a difference of 0.020%), Immigrants from Colombia (10.5%, a difference of 0.040%), Immigrants from Nepal (10.5%, a difference of 0.19%), Arab (10.5%, a difference of 0.20%), and Ethiopian (10.5%, a difference of 0.26%).
| Demographics | Rating | Rank | No Vehicles in Household |
| Immigrants | Burma/Myanmar | 49.1 /100 | #175 | Average 10.4% |
| French American Indians | 49.1 /100 | #176 | Average 10.4% |
| Immigrants | El Salvador | 49.1 /100 | #177 | Average 10.4% |
| Immigrants | Ethiopia | 48.0 /100 | #178 | Average 10.4% |
| Ethiopians | 45.8 /100 | #179 | Average 10.5% |
| Arabs | 45.3 /100 | #180 | Average 10.5% |
| Immigrants | Colombia | 44.1 /100 | #181 | Average 10.5% |
| Immigrants | Bulgaria | 43.8 /100 | #182 | Average 10.5% |
| Natives/Alaskans | 43.7 /100 | #183 | Average 10.5% |
| Immigrants | Nepal | 42.4 /100 | #184 | Average 10.5% |
| South Americans | 41.9 /100 | #185 | Average 10.5% |
| German Russians | 40.6 /100 | #186 | Average 10.5% |
| Immigrants | Poland | 38.4 /100 | #187 | Fair 10.6% |
| Immigrants | Armenia | 37.5 /100 | #188 | Fair 10.6% |
| Immigrants | Eritrea | 36.3 /100 | #189 | Fair 10.6% |