Welsh vs Ute Disability
COMPARE
Welsh
Ute
Disability
Disability Comparison
Welsh
Ute
12.9%
DISABILITY
0.0/ 100
METRIC RATING
284th/ 347
METRIC RANK
11.9%
DISABILITY
19.5/ 100
METRIC RATING
191st/ 347
METRIC RANK
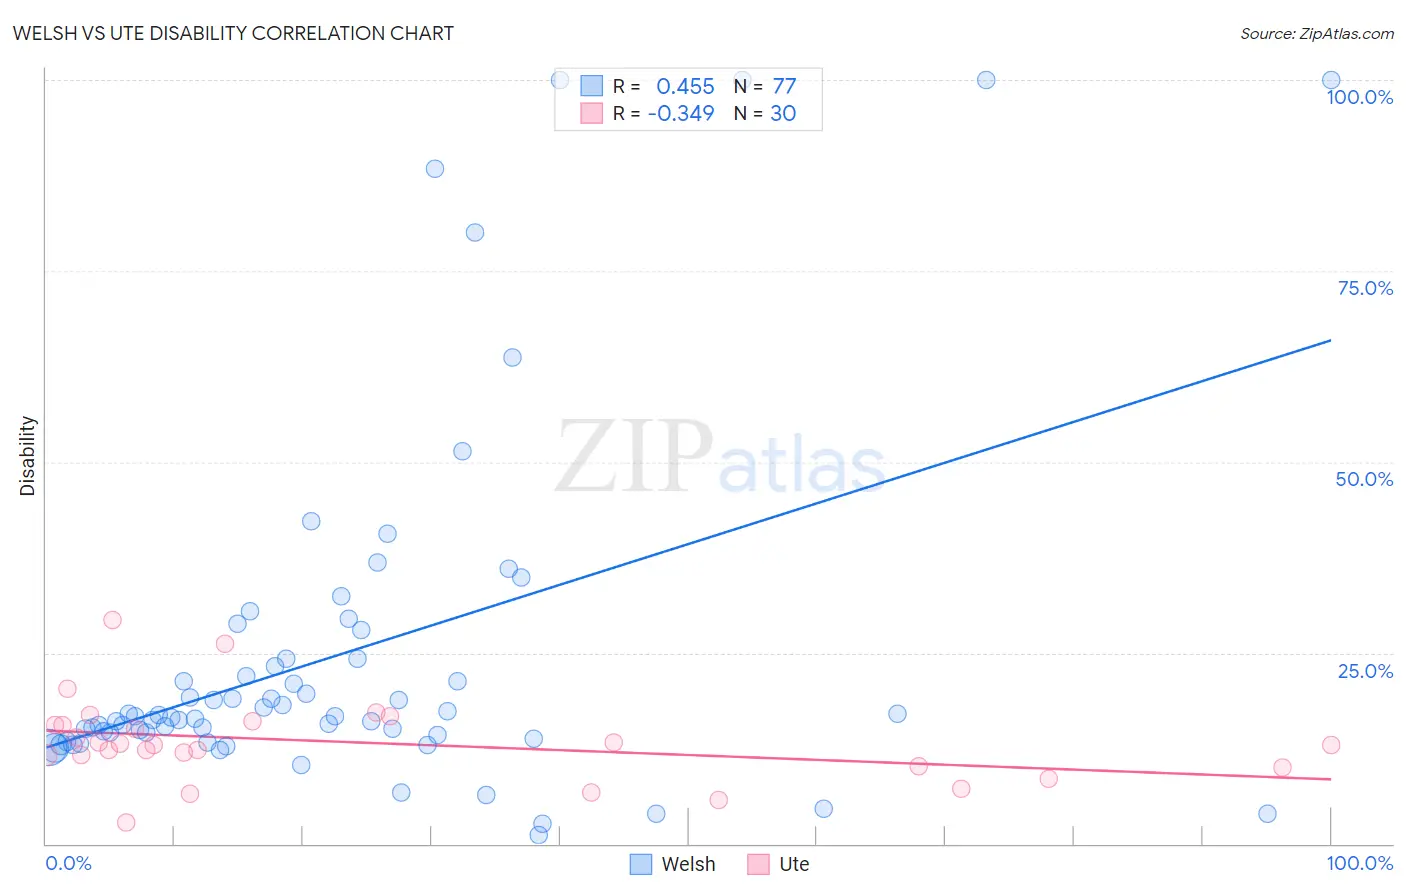
Welsh vs Ute Disability Correlation Chart
The statistical analysis conducted on geographies consisting of 528,530,777 people shows a moderate positive correlation between the proportion of Welsh and percentage of population with a disability in the United States with a correlation coefficient (R) of 0.455 and weighted average of 12.9%. Similarly, the statistical analysis conducted on geographies consisting of 55,668,381 people shows a mild negative correlation between the proportion of Ute and percentage of population with a disability in the United States with a correlation coefficient (R) of -0.349 and weighted average of 11.9%, a difference of 8.6%.
Disability Correlation Summary
| Measurement | Welsh | Ute |
| Minimum | 1.2% | 2.8% |
| Maximum | 100.0% | 29.3% |
| Range | 98.8% | 26.5% |
| Mean | 24.8% | 13.3% |
| Median | 16.7% | 12.9% |
| Interquartile 25% (IQ1) | 14.0% | 10.1% |
| Interquartile 75% (IQ3) | 24.2% | 15.6% |
| Interquartile Range (IQR) | 10.1% | 5.5% |
| Standard Deviation (Sample) | 23.0% | 5.5% |
| Standard Deviation (Population) | 22.8% | 5.4% |
Similar Demographics by Disability
Demographics Similar to Welsh by Disability
In terms of disability, the demographic groups most similar to Welsh are Crow (12.9%, a difference of 0.010%), Irish (12.9%, a difference of 0.19%), Scottish (12.9%, a difference of 0.22%), Immigrants from Portugal (12.9%, a difference of 0.36%), and English (13.0%, a difference of 0.39%).
| Demographics | Rating | Rank | Disability |
| Dutch | 0.0 /100 | #277 | Tragic 12.8% |
| Germans | 0.0 /100 | #278 | Tragic 12.8% |
| Fijians | 0.0 /100 | #279 | Tragic 12.8% |
| Spanish | 0.0 /100 | #280 | Tragic 12.8% |
| Immigrants | Portugal | 0.0 /100 | #281 | Tragic 12.9% |
| Scottish | 0.0 /100 | #282 | Tragic 12.9% |
| Irish | 0.0 /100 | #283 | Tragic 12.9% |
| Welsh | 0.0 /100 | #284 | Tragic 12.9% |
| Crow | 0.0 /100 | #285 | Tragic 12.9% |
| English | 0.0 /100 | #286 | Tragic 13.0% |
| Africans | 0.0 /100 | #287 | Tragic 13.0% |
| Whites/Caucasians | 0.0 /100 | #288 | Tragic 13.0% |
| Slovaks | 0.0 /100 | #289 | Tragic 13.0% |
| Cheyenne | 0.0 /100 | #290 | Tragic 13.0% |
| Yaqui | 0.0 /100 | #291 | Tragic 13.1% |
Demographics Similar to Ute by Disability
In terms of disability, the demographic groups most similar to Ute are Lithuanian (11.9%, a difference of 0.050%), Immigrants from Bosnia and Herzegovina (11.9%, a difference of 0.10%), Immigrants from West Indies (11.9%, a difference of 0.11%), Immigrants from Zaire (11.9%, a difference of 0.16%), and Somali (11.9%, a difference of 0.16%).
| Demographics | Rating | Rank | Disability |
| Iraqis | 30.0 /100 | #184 | Fair 11.8% |
| Immigrants | Burma/Myanmar | 28.5 /100 | #185 | Fair 11.8% |
| Immigrants | Scotland | 28.2 /100 | #186 | Fair 11.8% |
| Lebanese | 27.9 /100 | #187 | Fair 11.8% |
| Immigrants | Mexico | 23.8 /100 | #188 | Fair 11.9% |
| Immigrants | Zaire | 21.8 /100 | #189 | Fair 11.9% |
| Immigrants | West Indies | 21.1 /100 | #190 | Fair 11.9% |
| Ute | 19.5 /100 | #191 | Poor 11.9% |
| Lithuanians | 18.8 /100 | #192 | Poor 11.9% |
| Immigrants | Bosnia and Herzegovina | 18.0 /100 | #193 | Poor 11.9% |
| Somalis | 17.3 /100 | #194 | Poor 11.9% |
| Barbadians | 15.8 /100 | #195 | Poor 11.9% |
| Serbians | 15.4 /100 | #196 | Poor 11.9% |
| Immigrants | Belize | 15.2 /100 | #197 | Poor 11.9% |
| Ukrainians | 14.7 /100 | #198 | Poor 11.9% |