Welsh vs Immigrants from Brazil Vision Disability
COMPARE
Welsh
Immigrants from Brazil
Vision Disability
Vision Disability Comparison
Welsh
Immigrants from Brazil
2.3%
VISION DISABILITY
2.3/ 100
METRIC RATING
229th/ 347
METRIC RANK
2.2%
VISION DISABILITY
13.1/ 100
METRIC RATING
209th/ 347
METRIC RANK
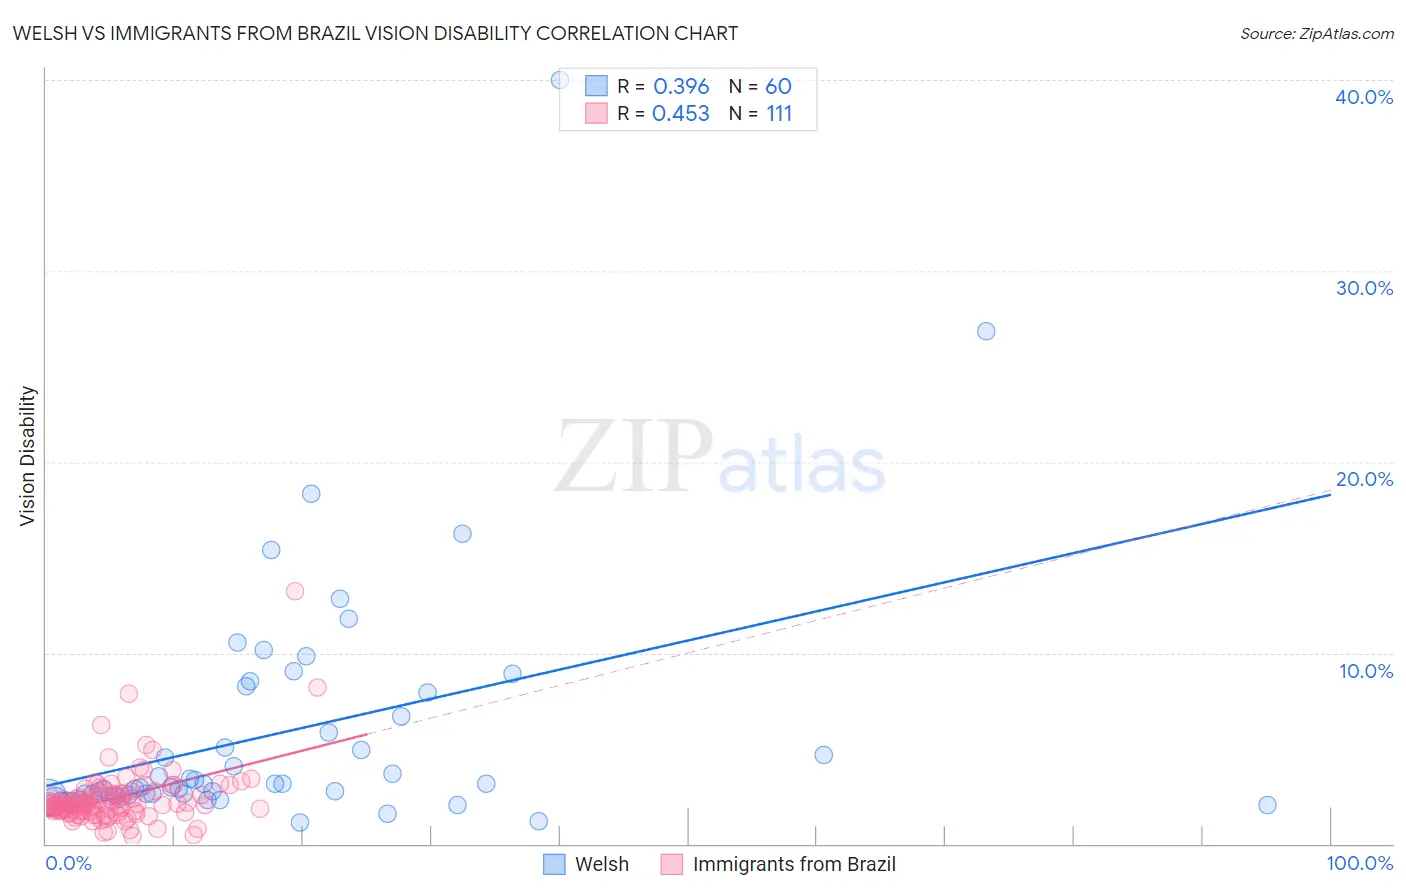
Welsh vs Immigrants from Brazil Vision Disability Correlation Chart
The statistical analysis conducted on geographies consisting of 527,426,081 people shows a mild positive correlation between the proportion of Welsh and percentage of population with vision disability in the United States with a correlation coefficient (R) of 0.396 and weighted average of 2.3%. Similarly, the statistical analysis conducted on geographies consisting of 342,850,216 people shows a moderate positive correlation between the proportion of Immigrants from Brazil and percentage of population with vision disability in the United States with a correlation coefficient (R) of 0.453 and weighted average of 2.2%, a difference of 2.8%.
Vision Disability Correlation Summary
| Measurement | Welsh | Immigrants from Brazil |
| Minimum | 1.1% | 0.36% |
| Maximum | 40.0% | 13.2% |
| Range | 38.9% | 12.9% |
| Mean | 5.8% | 2.4% |
| Median | 3.0% | 2.1% |
| Interquartile 25% (IQ1) | 2.5% | 1.7% |
| Interquartile 75% (IQ3) | 7.3% | 2.6% |
| Interquartile Range (IQR) | 4.8% | 0.94% |
| Standard Deviation (Sample) | 6.6% | 1.6% |
| Standard Deviation (Population) | 6.5% | 1.6% |
Demographics Similar to Welsh and Immigrants from Brazil by Vision Disability
In terms of vision disability, the demographic groups most similar to Welsh are Hmong (2.3%, a difference of 0.080%), Hawaiian (2.3%, a difference of 0.32%), Immigrants from Germany (2.3%, a difference of 0.37%), Immigrants from Western Africa (2.3%, a difference of 0.59%), and Irish (2.3%, a difference of 0.60%). Similarly, the demographic groups most similar to Immigrants from Brazil are Immigrants from Uruguay (2.2%, a difference of 0.23%), Indonesian (2.2%, a difference of 0.57%), Bermudan (2.2%, a difference of 0.66%), Immigrants from Ghana (2.2%, a difference of 0.67%), and Trinidadian and Tobagonian (2.2%, a difference of 0.80%).
| Demographics | Rating | Rank | Vision Disability |
| Immigrants | Brazil | 13.1 /100 | #209 | Poor 2.2% |
| Immigrants | Uruguay | 11.5 /100 | #210 | Poor 2.2% |
| Indonesians | 9.5 /100 | #211 | Tragic 2.2% |
| Bermudans | 9.0 /100 | #212 | Tragic 2.2% |
| Immigrants | Ghana | 8.9 /100 | #213 | Tragic 2.2% |
| Trinidadians and Tobagonians | 8.2 /100 | #214 | Tragic 2.2% |
| Nigerians | 7.2 /100 | #215 | Tragic 2.3% |
| Immigrants | Trinidad and Tobago | 6.1 /100 | #216 | Tragic 2.3% |
| Barbadians | 5.1 /100 | #217 | Tragic 2.3% |
| Portuguese | 4.9 /100 | #218 | Tragic 2.3% |
| Ecuadorians | 4.6 /100 | #219 | Tragic 2.3% |
| Guamanians/Chamorros | 3.9 /100 | #220 | Tragic 2.3% |
| French Canadians | 3.9 /100 | #221 | Tragic 2.3% |
| Immigrants | Senegal | 3.8 /100 | #222 | Tragic 2.3% |
| Basques | 3.5 /100 | #223 | Tragic 2.3% |
| Irish | 3.4 /100 | #224 | Tragic 2.3% |
| Immigrants | Western Africa | 3.4 /100 | #225 | Tragic 2.3% |
| Immigrants | Germany | 3.0 /100 | #226 | Tragic 2.3% |
| Hawaiians | 2.9 /100 | #227 | Tragic 2.3% |
| Hmong | 2.5 /100 | #228 | Tragic 2.3% |
| Welsh | 2.3 /100 | #229 | Tragic 2.3% |