Welsh vs New Zealander Vision Disability
COMPARE
Welsh
New Zealander
Vision Disability
Vision Disability Comparison
Welsh
New Zealanders
2.3%
VISION DISABILITY
2.3/ 100
METRIC RATING
229th/ 347
METRIC RANK
2.1%
VISION DISABILITY
88.2/ 100
METRIC RATING
132nd/ 347
METRIC RANK
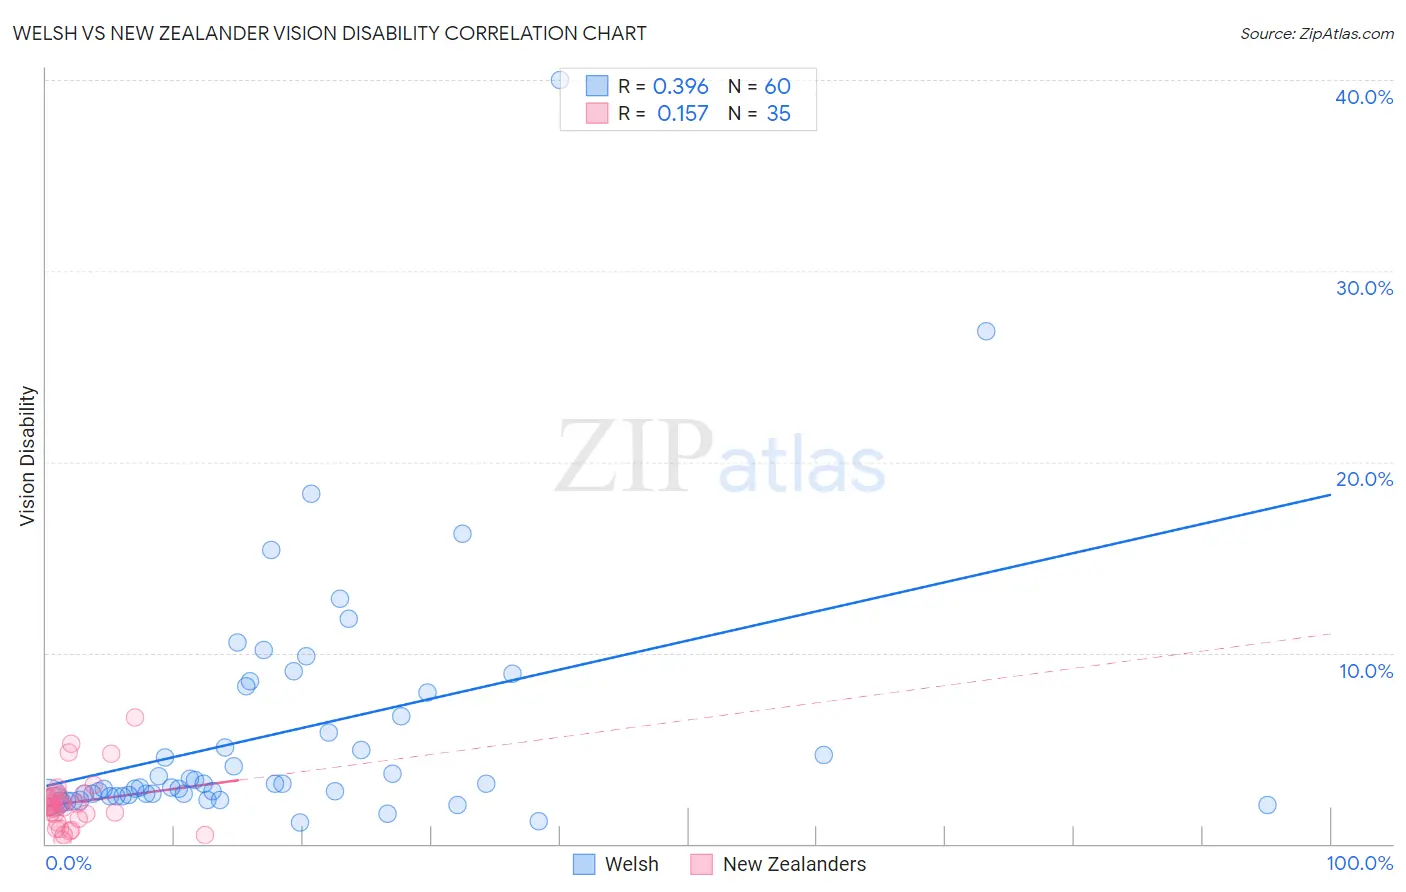
Welsh vs New Zealander Vision Disability Correlation Chart
The statistical analysis conducted on geographies consisting of 527,426,081 people shows a mild positive correlation between the proportion of Welsh and percentage of population with vision disability in the United States with a correlation coefficient (R) of 0.396 and weighted average of 2.3%. Similarly, the statistical analysis conducted on geographies consisting of 106,891,715 people shows a poor positive correlation between the proportion of New Zealanders and percentage of population with vision disability in the United States with a correlation coefficient (R) of 0.157 and weighted average of 2.1%, a difference of 9.3%.
Vision Disability Correlation Summary
| Measurement | Welsh | New Zealander |
| Minimum | 1.1% | 0.22% |
| Maximum | 40.0% | 6.6% |
| Range | 38.9% | 6.4% |
| Mean | 5.8% | 2.2% |
| Median | 3.0% | 1.9% |
| Interquartile 25% (IQ1) | 2.5% | 1.3% |
| Interquartile 75% (IQ3) | 7.3% | 2.5% |
| Interquartile Range (IQR) | 4.8% | 1.2% |
| Standard Deviation (Sample) | 6.6% | 1.4% |
| Standard Deviation (Population) | 6.5% | 1.4% |
Similar Demographics by Vision Disability
Demographics Similar to Welsh by Vision Disability
In terms of vision disability, the demographic groups most similar to Welsh are Nicaraguan (2.3%, a difference of 0.070%), Hmong (2.3%, a difference of 0.080%), Immigrants from Ecuador (2.3%, a difference of 0.23%), Hawaiian (2.3%, a difference of 0.32%), and Immigrants from Germany (2.3%, a difference of 0.37%).
| Demographics | Rating | Rank | Vision Disability |
| Immigrants | Senegal | 3.8 /100 | #222 | Tragic 2.3% |
| Basques | 3.5 /100 | #223 | Tragic 2.3% |
| Irish | 3.4 /100 | #224 | Tragic 2.3% |
| Immigrants | Western Africa | 3.4 /100 | #225 | Tragic 2.3% |
| Immigrants | Germany | 3.0 /100 | #226 | Tragic 2.3% |
| Hawaiians | 2.9 /100 | #227 | Tragic 2.3% |
| Hmong | 2.5 /100 | #228 | Tragic 2.3% |
| Welsh | 2.3 /100 | #229 | Tragic 2.3% |
| Nicaraguans | 2.2 /100 | #230 | Tragic 2.3% |
| Immigrants | Ecuador | 2.0 /100 | #231 | Tragic 2.3% |
| German Russians | 1.8 /100 | #232 | Tragic 2.3% |
| Central Americans | 1.8 /100 | #233 | Tragic 2.3% |
| Scottish | 1.6 /100 | #234 | Tragic 2.3% |
| Marshallese | 1.5 /100 | #235 | Tragic 2.3% |
| Immigrants | Congo | 1.4 /100 | #236 | Tragic 2.3% |
Demographics Similar to New Zealanders by Vision Disability
In terms of vision disability, the demographic groups most similar to New Zealanders are Immigrants from Hungary (2.1%, a difference of 0.080%), Immigrants from Kenya (2.1%, a difference of 0.090%), Immigrants from Cameroon (2.1%, a difference of 0.10%), Syrian (2.1%, a difference of 0.10%), and Immigrants from Chile (2.1%, a difference of 0.13%).
| Demographics | Rating | Rank | Vision Disability |
| Immigrants | Venezuela | 89.8 /100 | #125 | Excellent 2.1% |
| Immigrants | Peru | 89.5 /100 | #126 | Excellent 2.1% |
| Sudanese | 89.2 /100 | #127 | Excellent 2.1% |
| Immigrants | Chile | 89.0 /100 | #128 | Excellent 2.1% |
| Immigrants | Cameroon | 88.8 /100 | #129 | Excellent 2.1% |
| Immigrants | Kenya | 88.7 /100 | #130 | Excellent 2.1% |
| Immigrants | Hungary | 88.7 /100 | #131 | Excellent 2.1% |
| New Zealanders | 88.2 /100 | #132 | Excellent 2.1% |
| Syrians | 87.5 /100 | #133 | Excellent 2.1% |
| Venezuelans | 87.2 /100 | #134 | Excellent 2.1% |
| Vietnamese | 86.7 /100 | #135 | Excellent 2.1% |
| Czechs | 86.3 /100 | #136 | Excellent 2.1% |
| Immigrants | South Eastern Asia | 86.3 /100 | #137 | Excellent 2.1% |
| Arabs | 86.3 /100 | #138 | Excellent 2.1% |
| Immigrants | Morocco | 85.2 /100 | #139 | Excellent 2.1% |