Moroccan vs Immigrants from Brazil Vision Disability
COMPARE
Moroccan
Immigrants from Brazil
Vision Disability
Vision Disability Comparison
Moroccans
Immigrants from Brazil
2.2%
VISION DISABILITY
35.4/ 100
METRIC RATING
184th/ 347
METRIC RANK
2.2%
VISION DISABILITY
13.1/ 100
METRIC RATING
209th/ 347
METRIC RANK
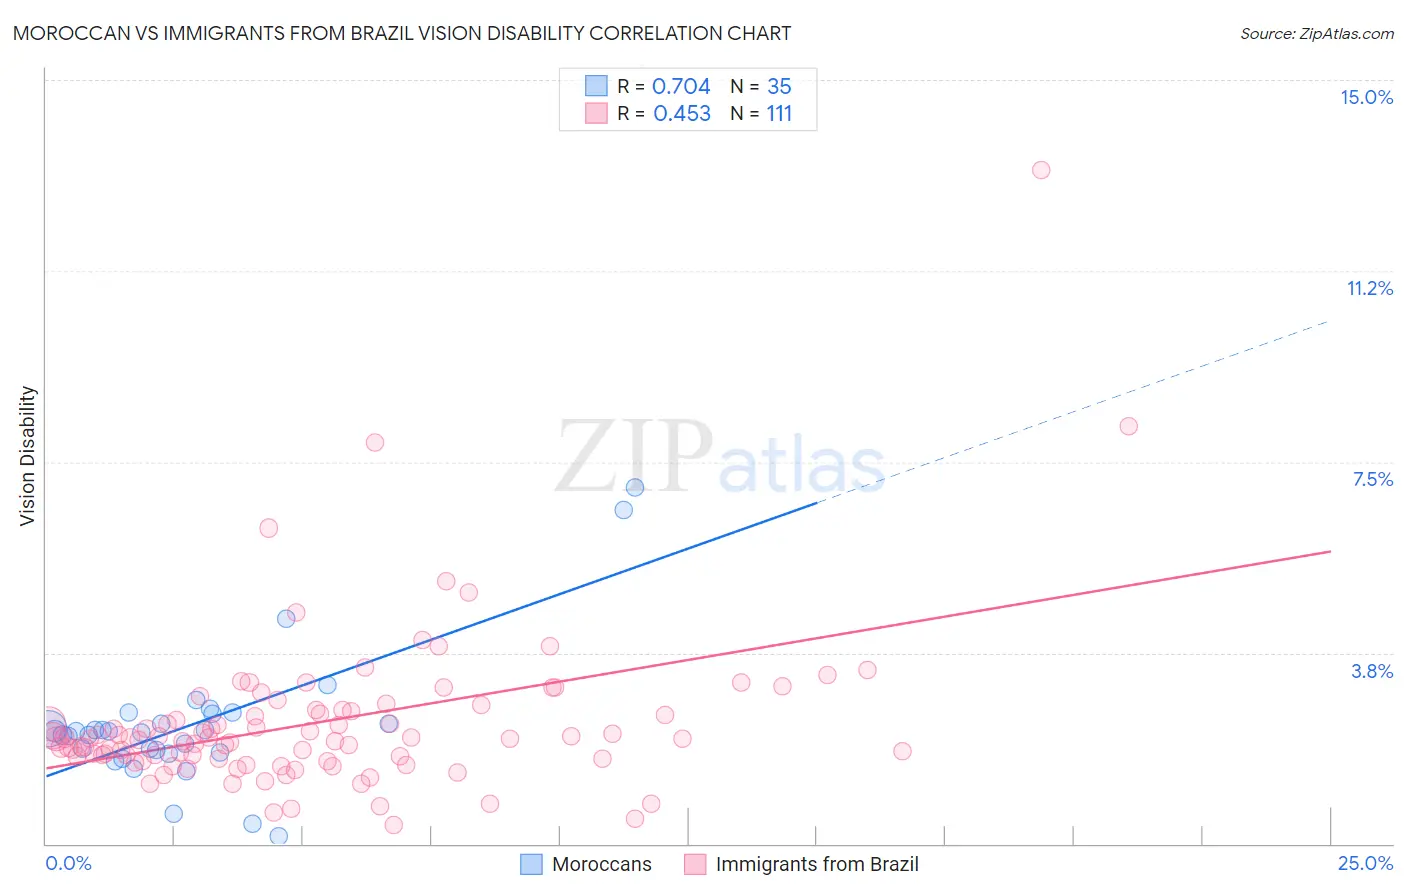
Moroccan vs Immigrants from Brazil Vision Disability Correlation Chart
The statistical analysis conducted on geographies consisting of 201,770,808 people shows a strong positive correlation between the proportion of Moroccans and percentage of population with vision disability in the United States with a correlation coefficient (R) of 0.704 and weighted average of 2.2%. Similarly, the statistical analysis conducted on geographies consisting of 342,850,216 people shows a moderate positive correlation between the proportion of Immigrants from Brazil and percentage of population with vision disability in the United States with a correlation coefficient (R) of 0.453 and weighted average of 2.2%, a difference of 2.0%.
Vision Disability Correlation Summary
| Measurement | Moroccan | Immigrants from Brazil |
| Minimum | 0.15% | 0.36% |
| Maximum | 7.0% | 13.2% |
| Range | 6.9% | 12.9% |
| Mean | 2.3% | 2.4% |
| Median | 2.2% | 2.1% |
| Interquartile 25% (IQ1) | 1.8% | 1.7% |
| Interquartile 75% (IQ3) | 2.6% | 2.6% |
| Interquartile Range (IQR) | 0.77% | 0.94% |
| Standard Deviation (Sample) | 1.3% | 1.6% |
| Standard Deviation (Population) | 1.3% | 1.6% |
Similar Demographics by Vision Disability
Demographics Similar to Moroccans by Vision Disability
In terms of vision disability, the demographic groups most similar to Moroccans are Immigrants from Middle Africa (2.2%, a difference of 0.13%), Native Hawaiian (2.2%, a difference of 0.14%), Immigrants from Burma/Myanmar (2.2%, a difference of 0.17%), Costa Rican (2.2%, a difference of 0.36%), and Immigrants from St. Vincent and the Grenadines (2.2%, a difference of 0.36%).
| Demographics | Rating | Rank | Vision Disability |
| Slavs | 46.0 /100 | #177 | Average 2.2% |
| Immigrants | Oceania | 45.1 /100 | #178 | Average 2.2% |
| Immigrants | North America | 44.5 /100 | #179 | Average 2.2% |
| Uruguayans | 42.7 /100 | #180 | Average 2.2% |
| Immigrants | Western Europe | 41.1 /100 | #181 | Average 2.2% |
| Costa Ricans | 40.7 /100 | #182 | Average 2.2% |
| Immigrants | Burma/Myanmar | 37.9 /100 | #183 | Fair 2.2% |
| Moroccans | 35.4 /100 | #184 | Fair 2.2% |
| Immigrants | Middle Africa | 33.5 /100 | #185 | Fair 2.2% |
| Native Hawaiians | 33.3 /100 | #186 | Fair 2.2% |
| Immigrants | St. Vincent and the Grenadines | 30.3 /100 | #187 | Fair 2.2% |
| Guyanese | 28.9 /100 | #188 | Fair 2.2% |
| Salvadorans | 27.4 /100 | #189 | Fair 2.2% |
| Immigrants | Costa Rica | 26.1 /100 | #190 | Fair 2.2% |
| Canadians | 25.8 /100 | #191 | Fair 2.2% |
Demographics Similar to Immigrants from Brazil by Vision Disability
In terms of vision disability, the demographic groups most similar to Immigrants from Brazil are Immigrants from Nigeria (2.2%, a difference of 0.040%), German (2.2%, a difference of 0.040%), Pennsylvania German (2.2%, a difference of 0.18%), Immigrants from Uruguay (2.2%, a difference of 0.23%), and Samoan (2.2%, a difference of 0.31%).
| Demographics | Rating | Rank | Vision Disability |
| Immigrants | Zaire | 18.0 /100 | #202 | Poor 2.2% |
| Dutch | 17.1 /100 | #203 | Poor 2.2% |
| Immigrants | Guyana | 15.9 /100 | #204 | Poor 2.2% |
| Samoans | 15.7 /100 | #205 | Poor 2.2% |
| Pennsylvania Germans | 14.5 /100 | #206 | Poor 2.2% |
| Immigrants | Nigeria | 13.5 /100 | #207 | Poor 2.2% |
| Germans | 13.4 /100 | #208 | Poor 2.2% |
| Immigrants | Brazil | 13.1 /100 | #209 | Poor 2.2% |
| Immigrants | Uruguay | 11.5 /100 | #210 | Poor 2.2% |
| Indonesians | 9.5 /100 | #211 | Tragic 2.2% |
| Bermudans | 9.0 /100 | #212 | Tragic 2.2% |
| Immigrants | Ghana | 8.9 /100 | #213 | Tragic 2.2% |
| Trinidadians and Tobagonians | 8.2 /100 | #214 | Tragic 2.2% |
| Nigerians | 7.2 /100 | #215 | Tragic 2.3% |
| Immigrants | Trinidad and Tobago | 6.1 /100 | #216 | Tragic 2.3% |