Welsh vs Immigrants from Brazil In Labor Force | Age 30-34
COMPARE
Welsh
Immigrants from Brazil
In Labor Force | Age 30-34
In Labor Force | Age 30-34 Comparison
Welsh
Immigrants from Brazil
84.2%
IN LABOR FORCE | AGE 30-34
2.7/ 100
METRIC RATING
229th/ 347
METRIC RANK
85.5%
IN LABOR FORCE | AGE 30-34
99.5/ 100
METRIC RATING
61st/ 347
METRIC RANK
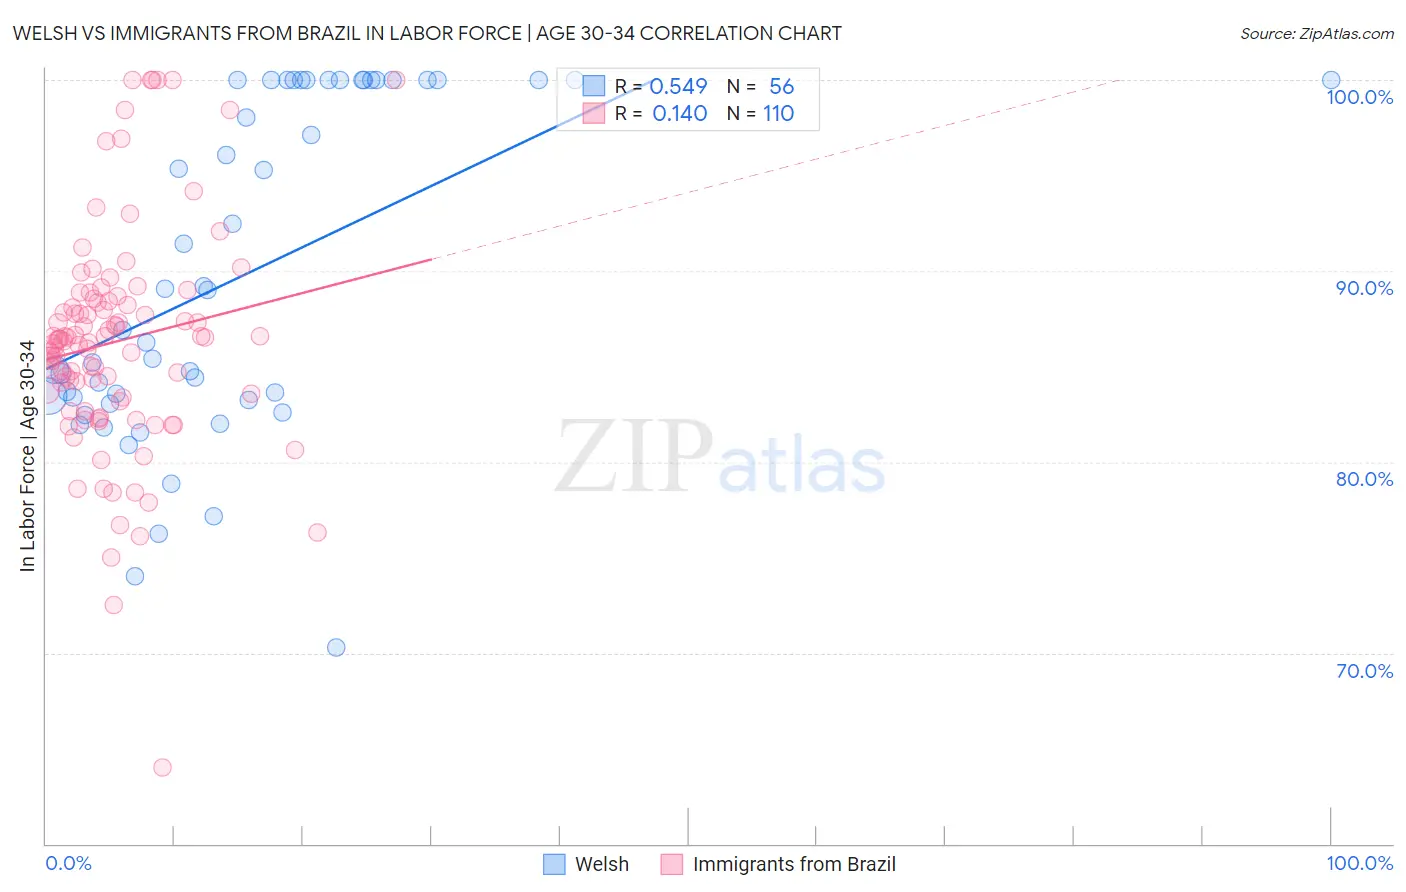
Welsh vs Immigrants from Brazil In Labor Force | Age 30-34 Correlation Chart
The statistical analysis conducted on geographies consisting of 527,874,569 people shows a substantial positive correlation between the proportion of Welsh and labor force participation rate among population between the ages 30 and 34 in the United States with a correlation coefficient (R) of 0.549 and weighted average of 84.2%. Similarly, the statistical analysis conducted on geographies consisting of 342,861,619 people shows a poor positive correlation between the proportion of Immigrants from Brazil and labor force participation rate among population between the ages 30 and 34 in the United States with a correlation coefficient (R) of 0.140 and weighted average of 85.5%, a difference of 1.6%.
In Labor Force | Age 30-34 Correlation Summary
| Measurement | Welsh | Immigrants from Brazil |
| Minimum | 70.3% | 64.0% |
| Maximum | 100.0% | 100.0% |
| Range | 29.7% | 36.0% |
| Mean | 89.9% | 86.3% |
| Median | 87.9% | 86.4% |
| Interquartile 25% (IQ1) | 83.3% | 83.4% |
| Interquartile 75% (IQ3) | 100.0% | 88.4% |
| Interquartile Range (IQR) | 16.7% | 5.1% |
| Standard Deviation (Sample) | 8.7% | 5.9% |
| Standard Deviation (Population) | 8.6% | 5.9% |
Similar Demographics by In Labor Force | Age 30-34
Demographics Similar to Welsh by In Labor Force | Age 30-34
In terms of in labor force | age 30-34, the demographic groups most similar to Welsh are Immigrants from Cuba (84.2%, a difference of 0.010%), Immigrants from Haiti (84.2%, a difference of 0.010%), Immigrants from Bahamas (84.1%, a difference of 0.010%), Scottish (84.2%, a difference of 0.020%), and Immigrants from El Salvador (84.2%, a difference of 0.020%).
| Demographics | Rating | Rank | In Labor Force | Age 30-34 |
| Panamanians | 3.8 /100 | #222 | Tragic 84.2% |
| Immigrants | Laos | 3.6 /100 | #223 | Tragic 84.2% |
| Cubans | 3.4 /100 | #224 | Tragic 84.2% |
| Scottish | 3.1 /100 | #225 | Tragic 84.2% |
| Immigrants | El Salvador | 3.0 /100 | #226 | Tragic 84.2% |
| Immigrants | Cuba | 3.0 /100 | #227 | Tragic 84.2% |
| Immigrants | Haiti | 2.8 /100 | #228 | Tragic 84.2% |
| Welsh | 2.7 /100 | #229 | Tragic 84.2% |
| Immigrants | Bahamas | 2.6 /100 | #230 | Tragic 84.1% |
| Malaysians | 2.2 /100 | #231 | Tragic 84.1% |
| Immigrants | Immigrants | 2.0 /100 | #232 | Tragic 84.1% |
| West Indians | 1.9 /100 | #233 | Tragic 84.1% |
| Haitians | 1.8 /100 | #234 | Tragic 84.1% |
| French American Indians | 1.7 /100 | #235 | Tragic 84.1% |
| U.S. Virgin Islanders | 1.5 /100 | #236 | Tragic 84.1% |
Demographics Similar to Immigrants from Brazil by In Labor Force | Age 30-34
In terms of in labor force | age 30-34, the demographic groups most similar to Immigrants from Brazil are Immigrants from France (85.5%, a difference of 0.0%), Soviet Union (85.5%, a difference of 0.010%), Macedonian (85.5%, a difference of 0.010%), Italian (85.4%, a difference of 0.020%), and Senegalese (85.4%, a difference of 0.020%).
| Demographics | Rating | Rank | In Labor Force | Age 30-34 |
| Immigrants | Kenya | 99.6 /100 | #54 | Exceptional 85.5% |
| Immigrants | Turkey | 99.6 /100 | #55 | Exceptional 85.5% |
| Czechs | 99.6 /100 | #56 | Exceptional 85.5% |
| Russians | 99.6 /100 | #57 | Exceptional 85.5% |
| Poles | 99.6 /100 | #58 | Exceptional 85.5% |
| Immigrants | Poland | 99.5 /100 | #59 | Exceptional 85.5% |
| Immigrants | France | 99.5 /100 | #60 | Exceptional 85.5% |
| Immigrants | Brazil | 99.5 /100 | #61 | Exceptional 85.5% |
| Soviet Union | 99.4 /100 | #62 | Exceptional 85.5% |
| Macedonians | 99.4 /100 | #63 | Exceptional 85.5% |
| Italians | 99.4 /100 | #64 | Exceptional 85.4% |
| Senegalese | 99.4 /100 | #65 | Exceptional 85.4% |
| Ghanaians | 99.4 /100 | #66 | Exceptional 85.4% |
| Kenyans | 99.3 /100 | #67 | Exceptional 85.4% |
| Immigrants | Eastern Europe | 99.3 /100 | #68 | Exceptional 85.4% |