Welsh vs Immigrants from Thailand Vision Disability
COMPARE
Welsh
Immigrants from Thailand
Vision Disability
Vision Disability Comparison
Welsh
Immigrants from Thailand
2.3%
VISION DISABILITY
2.3/ 100
METRIC RATING
229th/ 347
METRIC RANK
2.2%
VISION DISABILITY
20.1/ 100
METRIC RATING
200th/ 347
METRIC RANK
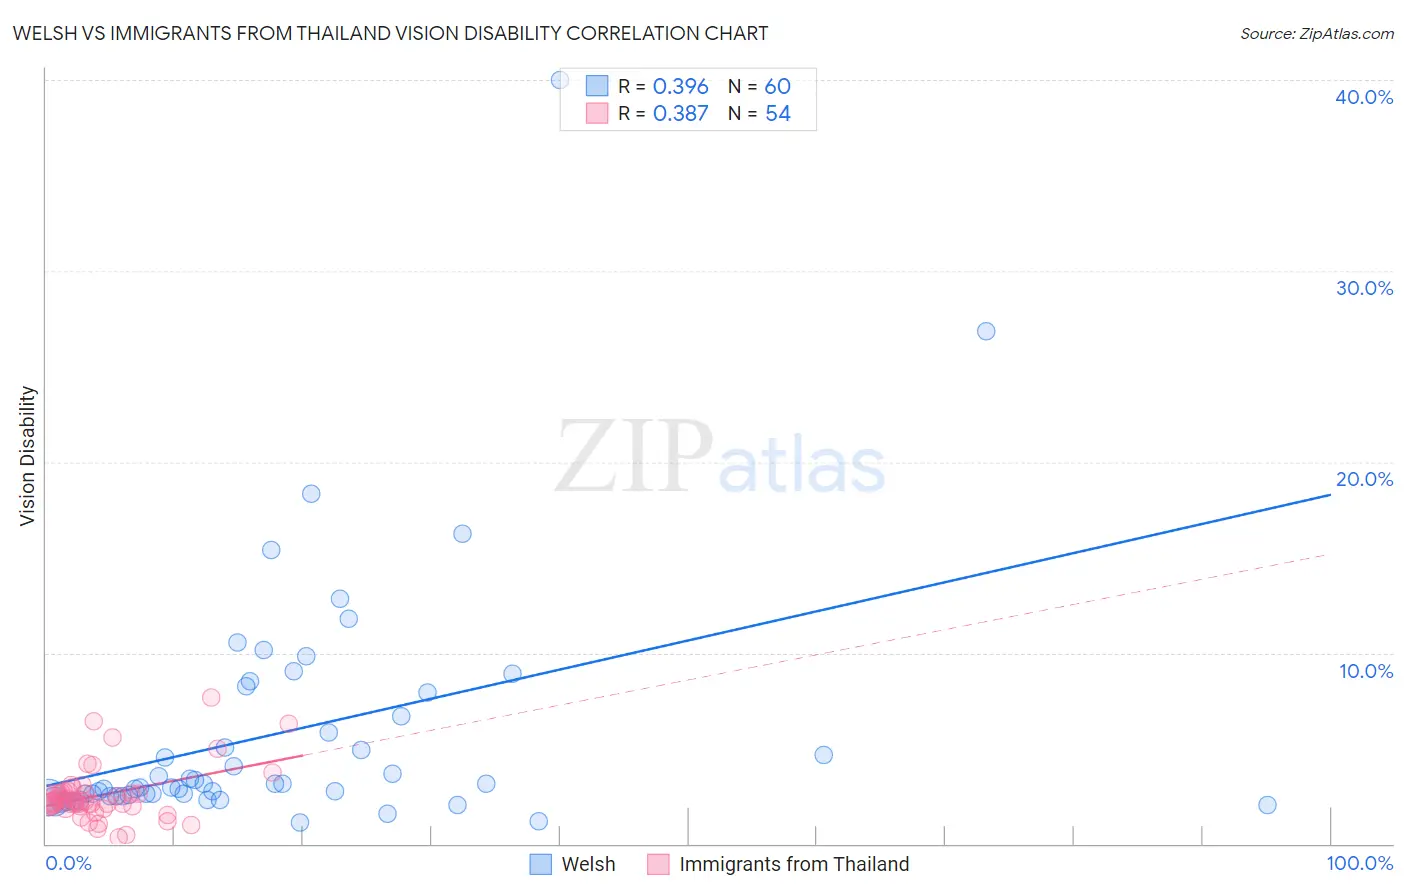
Welsh vs Immigrants from Thailand Vision Disability Correlation Chart
The statistical analysis conducted on geographies consisting of 527,426,081 people shows a mild positive correlation between the proportion of Welsh and percentage of population with vision disability in the United States with a correlation coefficient (R) of 0.396 and weighted average of 2.3%. Similarly, the statistical analysis conducted on geographies consisting of 316,876,708 people shows a mild positive correlation between the proportion of Immigrants from Thailand and percentage of population with vision disability in the United States with a correlation coefficient (R) of 0.387 and weighted average of 2.2%, a difference of 3.6%.
Vision Disability Correlation Summary
| Measurement | Welsh | Immigrants from Thailand |
| Minimum | 1.1% | 0.34% |
| Maximum | 40.0% | 7.7% |
| Range | 38.9% | 7.3% |
| Mean | 5.8% | 2.5% |
| Median | 3.0% | 2.2% |
| Interquartile 25% (IQ1) | 2.5% | 2.0% |
| Interquartile 75% (IQ3) | 7.3% | 2.7% |
| Interquartile Range (IQR) | 4.8% | 0.75% |
| Standard Deviation (Sample) | 6.6% | 1.4% |
| Standard Deviation (Population) | 6.5% | 1.4% |
Similar Demographics by Vision Disability
Demographics Similar to Welsh by Vision Disability
In terms of vision disability, the demographic groups most similar to Welsh are Nicaraguan (2.3%, a difference of 0.070%), Hmong (2.3%, a difference of 0.080%), Immigrants from Ecuador (2.3%, a difference of 0.23%), Hawaiian (2.3%, a difference of 0.32%), and Immigrants from Germany (2.3%, a difference of 0.37%).
| Demographics | Rating | Rank | Vision Disability |
| Immigrants | Senegal | 3.8 /100 | #222 | Tragic 2.3% |
| Basques | 3.5 /100 | #223 | Tragic 2.3% |
| Irish | 3.4 /100 | #224 | Tragic 2.3% |
| Immigrants | Western Africa | 3.4 /100 | #225 | Tragic 2.3% |
| Immigrants | Germany | 3.0 /100 | #226 | Tragic 2.3% |
| Hawaiians | 2.9 /100 | #227 | Tragic 2.3% |
| Hmong | 2.5 /100 | #228 | Tragic 2.3% |
| Welsh | 2.3 /100 | #229 | Tragic 2.3% |
| Nicaraguans | 2.2 /100 | #230 | Tragic 2.3% |
| Immigrants | Ecuador | 2.0 /100 | #231 | Tragic 2.3% |
| German Russians | 1.8 /100 | #232 | Tragic 2.3% |
| Central Americans | 1.8 /100 | #233 | Tragic 2.3% |
| Scottish | 1.6 /100 | #234 | Tragic 2.3% |
| Marshallese | 1.5 /100 | #235 | Tragic 2.3% |
| Immigrants | Congo | 1.4 /100 | #236 | Tragic 2.3% |
Demographics Similar to Immigrants from Thailand by Vision Disability
In terms of vision disability, the demographic groups most similar to Immigrants from Thailand are Immigrants from El Salvador (2.2%, a difference of 0.090%), Slovak (2.2%, a difference of 0.13%), Czechoslovakian (2.2%, a difference of 0.14%), Ghanaian (2.2%, a difference of 0.16%), and Immigrants from Zaire (2.2%, a difference of 0.22%).
| Demographics | Rating | Rank | Vision Disability |
| British | 25.1 /100 | #193 | Fair 2.2% |
| Immigrants | Barbados | 24.0 /100 | #194 | Fair 2.2% |
| Immigrants | Immigrants | 23.7 /100 | #195 | Fair 2.2% |
| Immigrants | Grenada | 23.1 /100 | #196 | Fair 2.2% |
| Ghanaians | 21.8 /100 | #197 | Fair 2.2% |
| Czechoslovakians | 21.6 /100 | #198 | Fair 2.2% |
| Immigrants | El Salvador | 21.0 /100 | #199 | Fair 2.2% |
| Immigrants | Thailand | 20.1 /100 | #200 | Fair 2.2% |
| Slovaks | 18.8 /100 | #201 | Poor 2.2% |
| Immigrants | Zaire | 18.0 /100 | #202 | Poor 2.2% |
| Dutch | 17.1 /100 | #203 | Poor 2.2% |
| Immigrants | Guyana | 15.9 /100 | #204 | Poor 2.2% |
| Samoans | 15.7 /100 | #205 | Poor 2.2% |
| Pennsylvania Germans | 14.5 /100 | #206 | Poor 2.2% |
| Immigrants | Nigeria | 13.5 /100 | #207 | Poor 2.2% |