Welsh vs Estonian Vision Disability
COMPARE
Welsh
Estonian
Vision Disability
Vision Disability Comparison
Welsh
Estonians
2.3%
VISION DISABILITY
2.3/ 100
METRIC RATING
229th/ 347
METRIC RANK
2.1%
VISION DISABILITY
95.3/ 100
METRIC RATING
99th/ 347
METRIC RANK
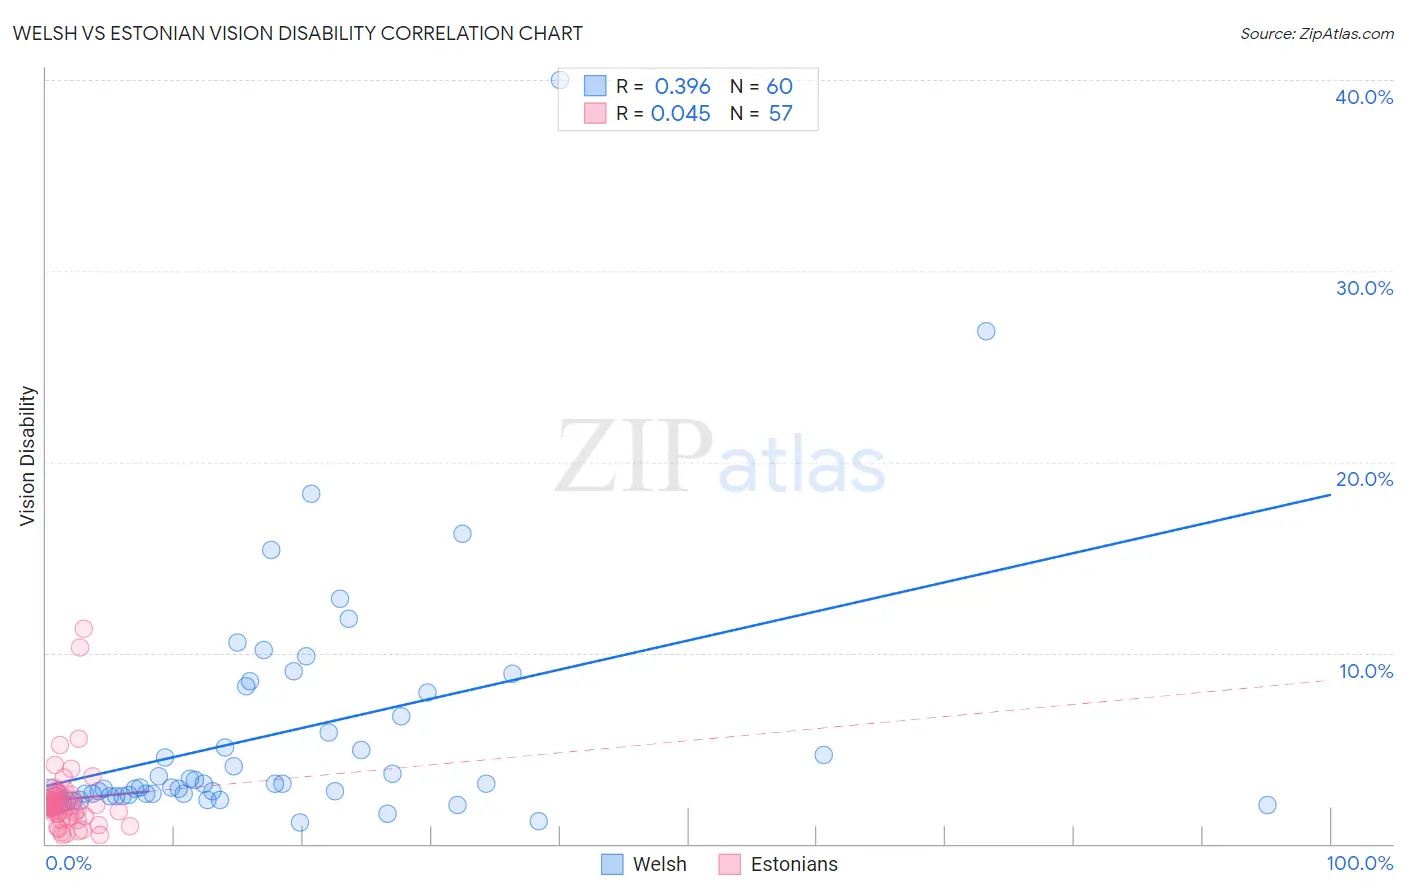
Welsh vs Estonian Vision Disability Correlation Chart
The statistical analysis conducted on geographies consisting of 527,426,081 people shows a mild positive correlation between the proportion of Welsh and percentage of population with vision disability in the United States with a correlation coefficient (R) of 0.396 and weighted average of 2.3%. Similarly, the statistical analysis conducted on geographies consisting of 123,516,084 people shows no correlation between the proportion of Estonians and percentage of population with vision disability in the United States with a correlation coefficient (R) of 0.045 and weighted average of 2.1%, a difference of 11.1%.
Vision Disability Correlation Summary
| Measurement | Welsh | Estonian |
| Minimum | 1.1% | 0.45% |
| Maximum | 40.0% | 11.3% |
| Range | 38.9% | 10.8% |
| Mean | 5.8% | 2.3% |
| Median | 3.0% | 2.0% |
| Interquartile 25% (IQ1) | 2.5% | 1.4% |
| Interquartile 75% (IQ3) | 7.3% | 2.6% |
| Interquartile Range (IQR) | 4.8% | 1.1% |
| Standard Deviation (Sample) | 6.6% | 1.9% |
| Standard Deviation (Population) | 6.5% | 1.9% |
Similar Demographics by Vision Disability
Demographics Similar to Welsh by Vision Disability
In terms of vision disability, the demographic groups most similar to Welsh are Nicaraguan (2.3%, a difference of 0.070%), Hmong (2.3%, a difference of 0.080%), Immigrants from Ecuador (2.3%, a difference of 0.23%), Hawaiian (2.3%, a difference of 0.32%), and Immigrants from Germany (2.3%, a difference of 0.37%).
| Demographics | Rating | Rank | Vision Disability |
| Immigrants | Senegal | 3.8 /100 | #222 | Tragic 2.3% |
| Basques | 3.5 /100 | #223 | Tragic 2.3% |
| Irish | 3.4 /100 | #224 | Tragic 2.3% |
| Immigrants | Western Africa | 3.4 /100 | #225 | Tragic 2.3% |
| Immigrants | Germany | 3.0 /100 | #226 | Tragic 2.3% |
| Hawaiians | 2.9 /100 | #227 | Tragic 2.3% |
| Hmong | 2.5 /100 | #228 | Tragic 2.3% |
| Welsh | 2.3 /100 | #229 | Tragic 2.3% |
| Nicaraguans | 2.2 /100 | #230 | Tragic 2.3% |
| Immigrants | Ecuador | 2.0 /100 | #231 | Tragic 2.3% |
| German Russians | 1.8 /100 | #232 | Tragic 2.3% |
| Central Americans | 1.8 /100 | #233 | Tragic 2.3% |
| Scottish | 1.6 /100 | #234 | Tragic 2.3% |
| Marshallese | 1.5 /100 | #235 | Tragic 2.3% |
| Immigrants | Congo | 1.4 /100 | #236 | Tragic 2.3% |
Demographics Similar to Estonians by Vision Disability
In terms of vision disability, the demographic groups most similar to Estonians are Greek (2.1%, a difference of 0.040%), Immigrants from South Africa (2.1%, a difference of 0.070%), Immigrants from Afghanistan (2.1%, a difference of 0.12%), Albanian (2.1%, a difference of 0.12%), and Sri Lankan (2.1%, a difference of 0.15%).
| Demographics | Rating | Rank | Vision Disability |
| Immigrants | Syria | 96.2 /100 | #92 | Exceptional 2.1% |
| Immigrants | Europe | 96.1 /100 | #93 | Exceptional 2.1% |
| Immigrants | Croatia | 96.0 /100 | #94 | Exceptional 2.1% |
| Australians | 95.9 /100 | #95 | Exceptional 2.1% |
| Romanians | 95.7 /100 | #96 | Exceptional 2.1% |
| Immigrants | Afghanistan | 95.6 /100 | #97 | Exceptional 2.1% |
| Immigrants | South Africa | 95.4 /100 | #98 | Exceptional 2.1% |
| Estonians | 95.3 /100 | #99 | Exceptional 2.1% |
| Greeks | 95.1 /100 | #100 | Exceptional 2.1% |
| Albanians | 94.9 /100 | #101 | Exceptional 2.1% |
| Sri Lankans | 94.8 /100 | #102 | Exceptional 2.1% |
| Immigrants | Austria | 94.4 /100 | #103 | Exceptional 2.1% |
| Immigrants | Italy | 94.4 /100 | #104 | Exceptional 2.1% |
| Carpatho Rusyns | 94.3 /100 | #105 | Exceptional 2.1% |
| Swedes | 94.2 /100 | #106 | Exceptional 2.1% |