Welsh vs Laotian Vision Disability
COMPARE
Welsh
Laotian
Vision Disability
Vision Disability Comparison
Welsh
Laotians
2.3%
VISION DISABILITY
2.3/ 100
METRIC RATING
229th/ 347
METRIC RANK
2.0%
VISION DISABILITY
99.3/ 100
METRIC RATING
55th/ 347
METRIC RANK
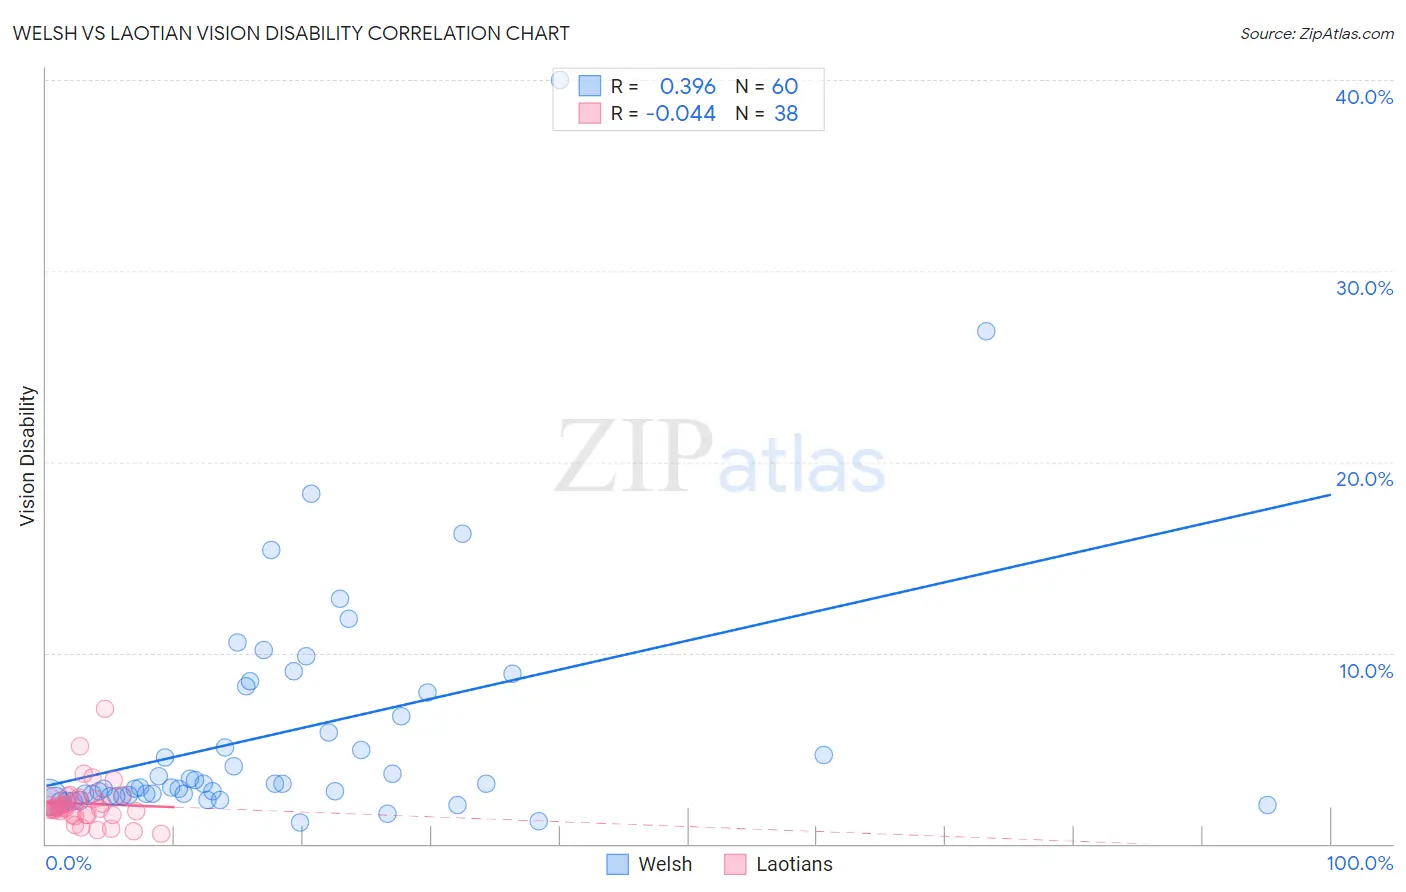
Welsh vs Laotian Vision Disability Correlation Chart
The statistical analysis conducted on geographies consisting of 527,426,081 people shows a mild positive correlation between the proportion of Welsh and percentage of population with vision disability in the United States with a correlation coefficient (R) of 0.396 and weighted average of 2.3%. Similarly, the statistical analysis conducted on geographies consisting of 224,815,117 people shows no correlation between the proportion of Laotians and percentage of population with vision disability in the United States with a correlation coefficient (R) of -0.044 and weighted average of 2.0%, a difference of 14.9%.
Vision Disability Correlation Summary
| Measurement | Welsh | Laotian |
| Minimum | 1.1% | 0.55% |
| Maximum | 40.0% | 7.1% |
| Range | 38.9% | 6.5% |
| Mean | 5.8% | 2.1% |
| Median | 3.0% | 1.9% |
| Interquartile 25% (IQ1) | 2.5% | 1.5% |
| Interquartile 75% (IQ3) | 7.3% | 2.4% |
| Interquartile Range (IQR) | 4.8% | 0.88% |
| Standard Deviation (Sample) | 6.6% | 1.2% |
| Standard Deviation (Population) | 6.5% | 1.2% |
Similar Demographics by Vision Disability
Demographics Similar to Welsh by Vision Disability
In terms of vision disability, the demographic groups most similar to Welsh are Nicaraguan (2.3%, a difference of 0.070%), Hmong (2.3%, a difference of 0.080%), Immigrants from Ecuador (2.3%, a difference of 0.23%), Hawaiian (2.3%, a difference of 0.32%), and Immigrants from Germany (2.3%, a difference of 0.37%).
| Demographics | Rating | Rank | Vision Disability |
| Immigrants | Senegal | 3.8 /100 | #222 | Tragic 2.3% |
| Basques | 3.5 /100 | #223 | Tragic 2.3% |
| Irish | 3.4 /100 | #224 | Tragic 2.3% |
| Immigrants | Western Africa | 3.4 /100 | #225 | Tragic 2.3% |
| Immigrants | Germany | 3.0 /100 | #226 | Tragic 2.3% |
| Hawaiians | 2.9 /100 | #227 | Tragic 2.3% |
| Hmong | 2.5 /100 | #228 | Tragic 2.3% |
| Welsh | 2.3 /100 | #229 | Tragic 2.3% |
| Nicaraguans | 2.2 /100 | #230 | Tragic 2.3% |
| Immigrants | Ecuador | 2.0 /100 | #231 | Tragic 2.3% |
| German Russians | 1.8 /100 | #232 | Tragic 2.3% |
| Central Americans | 1.8 /100 | #233 | Tragic 2.3% |
| Scottish | 1.6 /100 | #234 | Tragic 2.3% |
| Marshallese | 1.5 /100 | #235 | Tragic 2.3% |
| Immigrants | Congo | 1.4 /100 | #236 | Tragic 2.3% |
Demographics Similar to Laotians by Vision Disability
In terms of vision disability, the demographic groups most similar to Laotians are Macedonian (2.0%, a difference of 0.060%), Immigrants from Belarus (2.0%, a difference of 0.090%), Jordanian (2.0%, a difference of 0.17%), Somali (2.0%, a difference of 0.19%), and Immigrants from Serbia (2.0%, a difference of 0.21%).
| Demographics | Rating | Rank | Vision Disability |
| Israelis | 99.6 /100 | #48 | Exceptional 2.0% |
| Latvians | 99.5 /100 | #49 | Exceptional 2.0% |
| Afghans | 99.5 /100 | #50 | Exceptional 2.0% |
| Tongans | 99.5 /100 | #51 | Exceptional 2.0% |
| Immigrants | Serbia | 99.4 /100 | #52 | Exceptional 2.0% |
| Immigrants | Belarus | 99.3 /100 | #53 | Exceptional 2.0% |
| Macedonians | 99.3 /100 | #54 | Exceptional 2.0% |
| Laotians | 99.3 /100 | #55 | Exceptional 2.0% |
| Jordanians | 99.2 /100 | #56 | Exceptional 2.0% |
| Somalis | 99.2 /100 | #57 | Exceptional 2.0% |
| Immigrants | Saudi Arabia | 99.2 /100 | #58 | Exceptional 2.0% |
| Argentineans | 99.1 /100 | #59 | Exceptional 2.0% |
| Immigrants | Romania | 99.1 /100 | #60 | Exceptional 2.0% |
| Immigrants | Belgium | 99.1 /100 | #61 | Exceptional 2.0% |
| Immigrants | Russia | 99.1 /100 | #62 | Exceptional 2.0% |