Sudanese vs Immigrants from Brazil Vision Disability
COMPARE
Sudanese
Immigrants from Brazil
Vision Disability
Vision Disability Comparison
Sudanese
Immigrants from Brazil
2.1%
VISION DISABILITY
89.2/ 100
METRIC RATING
127th/ 347
METRIC RANK
2.2%
VISION DISABILITY
13.1/ 100
METRIC RATING
209th/ 347
METRIC RANK
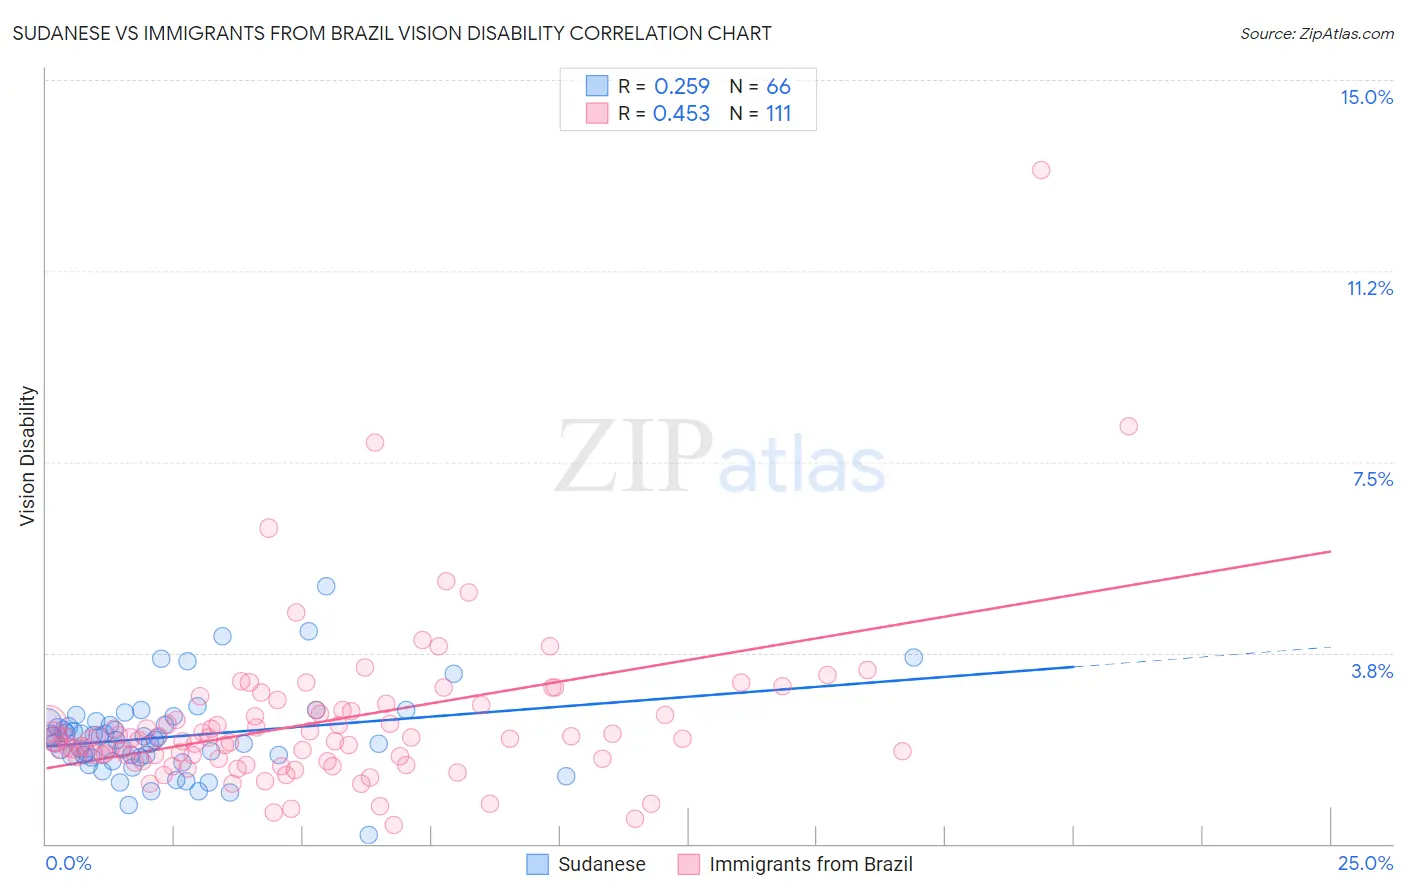
Sudanese vs Immigrants from Brazil Vision Disability Correlation Chart
The statistical analysis conducted on geographies consisting of 110,115,679 people shows a weak positive correlation between the proportion of Sudanese and percentage of population with vision disability in the United States with a correlation coefficient (R) of 0.259 and weighted average of 2.1%. Similarly, the statistical analysis conducted on geographies consisting of 342,850,216 people shows a moderate positive correlation between the proportion of Immigrants from Brazil and percentage of population with vision disability in the United States with a correlation coefficient (R) of 0.453 and weighted average of 2.2%, a difference of 6.5%.
Vision Disability Correlation Summary
| Measurement | Sudanese | Immigrants from Brazil |
| Minimum | 0.17% | 0.36% |
| Maximum | 5.1% | 13.2% |
| Range | 4.9% | 12.9% |
| Mean | 2.1% | 2.4% |
| Median | 2.0% | 2.1% |
| Interquartile 25% (IQ1) | 1.7% | 1.7% |
| Interquartile 75% (IQ3) | 2.3% | 2.6% |
| Interquartile Range (IQR) | 0.64% | 0.94% |
| Standard Deviation (Sample) | 0.82% | 1.6% |
| Standard Deviation (Population) | 0.81% | 1.6% |
Similar Demographics by Vision Disability
Demographics Similar to Sudanese by Vision Disability
In terms of vision disability, the demographic groups most similar to Sudanese are Immigrants from Chile (2.1%, a difference of 0.030%), Immigrants from Peru (2.1%, a difference of 0.060%), Immigrants from Cameroon (2.1%, a difference of 0.070%), Immigrants from Kenya (2.1%, a difference of 0.070%), and Immigrants from Hungary (2.1%, a difference of 0.090%).
| Demographics | Rating | Rank | Vision Disability |
| Immigrants | Zimbabwe | 91.0 /100 | #120 | Exceptional 2.1% |
| Immigrants | Scotland | 90.4 /100 | #121 | Exceptional 2.1% |
| Immigrants | Ukraine | 90.4 /100 | #122 | Exceptional 2.1% |
| Immigrants | Albania | 90.4 /100 | #123 | Exceptional 2.1% |
| Immigrants | Spain | 89.8 /100 | #124 | Excellent 2.1% |
| Immigrants | Venezuela | 89.8 /100 | #125 | Excellent 2.1% |
| Immigrants | Peru | 89.5 /100 | #126 | Excellent 2.1% |
| Sudanese | 89.2 /100 | #127 | Excellent 2.1% |
| Immigrants | Chile | 89.0 /100 | #128 | Excellent 2.1% |
| Immigrants | Cameroon | 88.8 /100 | #129 | Excellent 2.1% |
| Immigrants | Kenya | 88.7 /100 | #130 | Excellent 2.1% |
| Immigrants | Hungary | 88.7 /100 | #131 | Excellent 2.1% |
| New Zealanders | 88.2 /100 | #132 | Excellent 2.1% |
| Syrians | 87.5 /100 | #133 | Excellent 2.1% |
| Venezuelans | 87.2 /100 | #134 | Excellent 2.1% |
Demographics Similar to Immigrants from Brazil by Vision Disability
In terms of vision disability, the demographic groups most similar to Immigrants from Brazil are Immigrants from Nigeria (2.2%, a difference of 0.040%), German (2.2%, a difference of 0.040%), Pennsylvania German (2.2%, a difference of 0.18%), Immigrants from Uruguay (2.2%, a difference of 0.23%), and Samoan (2.2%, a difference of 0.31%).
| Demographics | Rating | Rank | Vision Disability |
| Immigrants | Zaire | 18.0 /100 | #202 | Poor 2.2% |
| Dutch | 17.1 /100 | #203 | Poor 2.2% |
| Immigrants | Guyana | 15.9 /100 | #204 | Poor 2.2% |
| Samoans | 15.7 /100 | #205 | Poor 2.2% |
| Pennsylvania Germans | 14.5 /100 | #206 | Poor 2.2% |
| Immigrants | Nigeria | 13.5 /100 | #207 | Poor 2.2% |
| Germans | 13.4 /100 | #208 | Poor 2.2% |
| Immigrants | Brazil | 13.1 /100 | #209 | Poor 2.2% |
| Immigrants | Uruguay | 11.5 /100 | #210 | Poor 2.2% |
| Indonesians | 9.5 /100 | #211 | Tragic 2.2% |
| Bermudans | 9.0 /100 | #212 | Tragic 2.2% |
| Immigrants | Ghana | 8.9 /100 | #213 | Tragic 2.2% |
| Trinidadians and Tobagonians | 8.2 /100 | #214 | Tragic 2.2% |
| Nigerians | 7.2 /100 | #215 | Tragic 2.3% |
| Immigrants | Trinidad and Tobago | 6.1 /100 | #216 | Tragic 2.3% |