Immigrants from Zimbabwe vs Yuman Ambulatory Disability
COMPARE
Immigrants from Zimbabwe
Yuman
Ambulatory Disability
Ambulatory Disability Comparison
Immigrants from Zimbabwe
Yuman
5.6%
AMBULATORY DISABILITY
99.8/ 100
METRIC RATING
58th/ 347
METRIC RANK
7.9%
AMBULATORY DISABILITY
0.0/ 100
METRIC RATING
334th/ 347
METRIC RANK
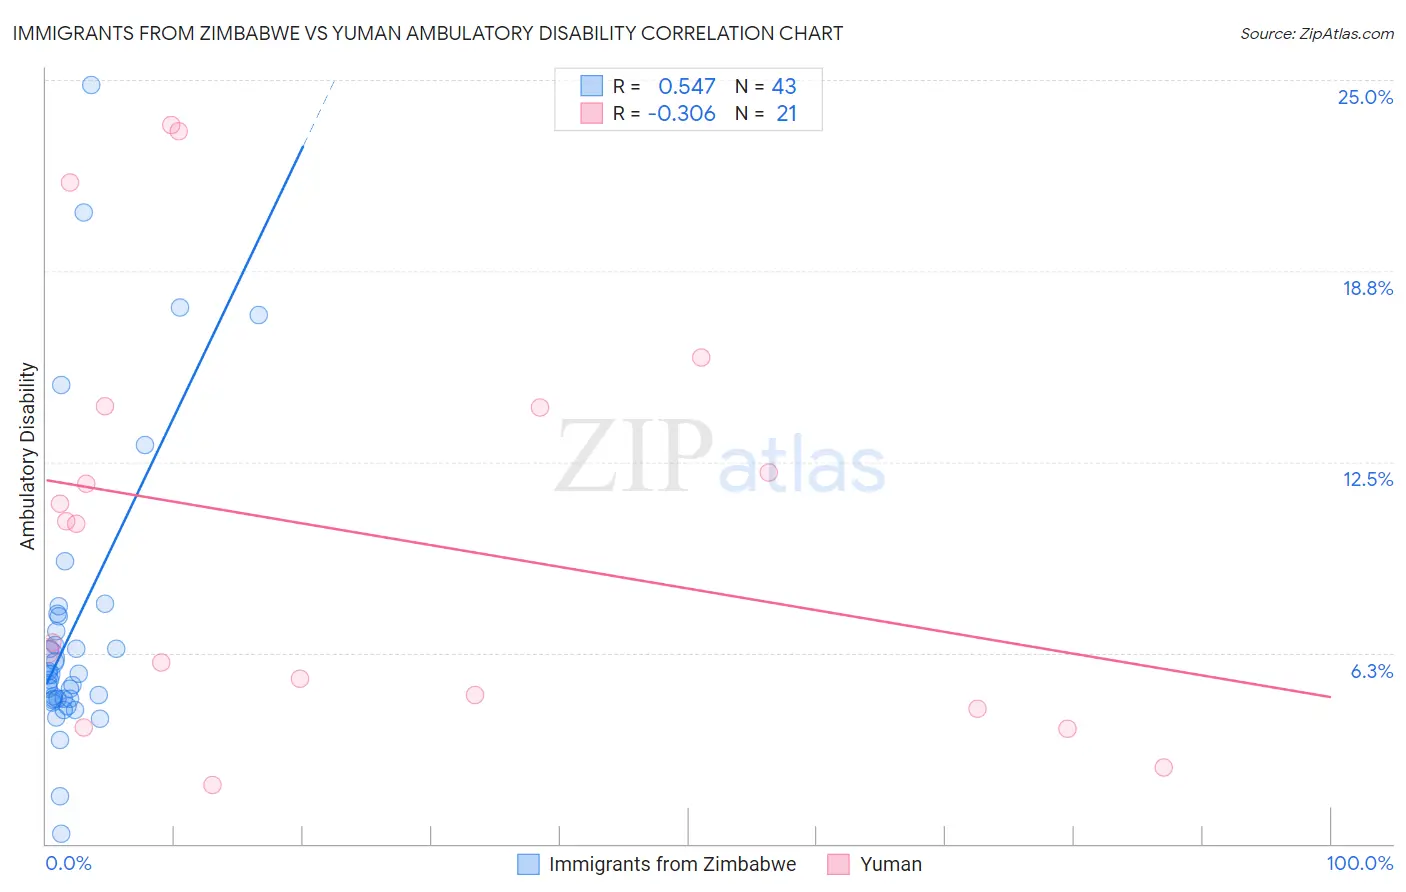
Immigrants from Zimbabwe vs Yuman Ambulatory Disability Correlation Chart
The statistical analysis conducted on geographies consisting of 117,792,147 people shows a substantial positive correlation between the proportion of Immigrants from Zimbabwe and percentage of population with ambulatory disability in the United States with a correlation coefficient (R) of 0.547 and weighted average of 5.6%. Similarly, the statistical analysis conducted on geographies consisting of 40,645,433 people shows a mild negative correlation between the proportion of Yuman and percentage of population with ambulatory disability in the United States with a correlation coefficient (R) of -0.306 and weighted average of 7.9%, a difference of 41.2%.
Ambulatory Disability Correlation Summary
| Measurement | Immigrants from Zimbabwe | Yuman |
| Minimum | 0.34% | 1.9% |
| Maximum | 24.9% | 23.5% |
| Range | 24.5% | 21.6% |
| Mean | 7.1% | 10.2% |
| Median | 5.5% | 10.5% |
| Interquartile 25% (IQ1) | 4.7% | 4.6% |
| Interquartile 75% (IQ3) | 7.5% | 14.3% |
| Interquartile Range (IQR) | 2.7% | 9.7% |
| Standard Deviation (Sample) | 4.9% | 6.7% |
| Standard Deviation (Population) | 4.9% | 6.5% |
Similar Demographics by Ambulatory Disability
Demographics Similar to Immigrants from Zimbabwe by Ambulatory Disability
In terms of ambulatory disability, the demographic groups most similar to Immigrants from Zimbabwe are Immigrants from Afghanistan (5.6%, a difference of 0.040%), Immigrants from Brazil (5.6%, a difference of 0.060%), Immigrants from Lithuania (5.6%, a difference of 0.080%), Immigrants from Belgium (5.6%, a difference of 0.20%), and Immigrants from Spain (5.6%, a difference of 0.21%).
| Demographics | Rating | Rank | Ambulatory Disability |
| Taiwanese | 99.8 /100 | #51 | Exceptional 5.6% |
| Jordanians | 99.8 /100 | #52 | Exceptional 5.6% |
| Immigrants | Egypt | 99.8 /100 | #53 | Exceptional 5.6% |
| Immigrants | Eastern Africa | 99.8 /100 | #54 | Exceptional 5.6% |
| Immigrants | Bulgaria | 99.8 /100 | #55 | Exceptional 5.6% |
| Inupiat | 99.8 /100 | #56 | Exceptional 5.6% |
| Immigrants | Brazil | 99.8 /100 | #57 | Exceptional 5.6% |
| Immigrants | Zimbabwe | 99.8 /100 | #58 | Exceptional 5.6% |
| Immigrants | Afghanistan | 99.8 /100 | #59 | Exceptional 5.6% |
| Immigrants | Lithuania | 99.8 /100 | #60 | Exceptional 5.6% |
| Immigrants | Belgium | 99.7 /100 | #61 | Exceptional 5.6% |
| Immigrants | Spain | 99.7 /100 | #62 | Exceptional 5.6% |
| Immigrants | France | 99.7 /100 | #63 | Exceptional 5.6% |
| Laotians | 99.7 /100 | #64 | Exceptional 5.7% |
| Immigrants | Switzerland | 99.7 /100 | #65 | Exceptional 5.7% |
Demographics Similar to Yuman by Ambulatory Disability
In terms of ambulatory disability, the demographic groups most similar to Yuman are Cherokee (7.9%, a difference of 0.94%), Chickasaw (8.0%, a difference of 1.1%), Seminole (8.0%, a difference of 1.2%), Menominee (7.8%, a difference of 1.8%), and Cajun (7.8%, a difference of 2.1%).
| Demographics | Rating | Rank | Ambulatory Disability |
| Natives/Alaskans | 0.0 /100 | #327 | Tragic 7.5% |
| Hopi | 0.0 /100 | #328 | Tragic 7.6% |
| Pueblo | 0.0 /100 | #329 | Tragic 7.6% |
| Paiute | 0.0 /100 | #330 | Tragic 7.7% |
| Cajuns | 0.0 /100 | #331 | Tragic 7.8% |
| Menominee | 0.0 /100 | #332 | Tragic 7.8% |
| Cherokee | 0.0 /100 | #333 | Tragic 7.9% |
| Yuman | 0.0 /100 | #334 | Tragic 7.9% |
| Chickasaw | 0.0 /100 | #335 | Tragic 8.0% |
| Seminole | 0.0 /100 | #336 | Tragic 8.0% |
| Dutch West Indians | 0.0 /100 | #337 | Tragic 8.2% |
| Colville | 0.0 /100 | #338 | Tragic 8.2% |
| Pima | 0.0 /100 | #339 | Tragic 8.2% |
| Choctaw | 0.0 /100 | #340 | Tragic 8.3% |
| Creek | 0.0 /100 | #341 | Tragic 8.5% |