Thai vs Sioux Vision Disability
COMPARE
Thai
Sioux
Vision Disability
Vision Disability Comparison
Thais
Sioux
1.7%
VISION DISABILITY
100.0/ 100
METRIC RATING
4th/ 347
METRIC RANK
2.5%
VISION DISABILITY
0.0/ 100
METRIC RATING
286th/ 347
METRIC RANK
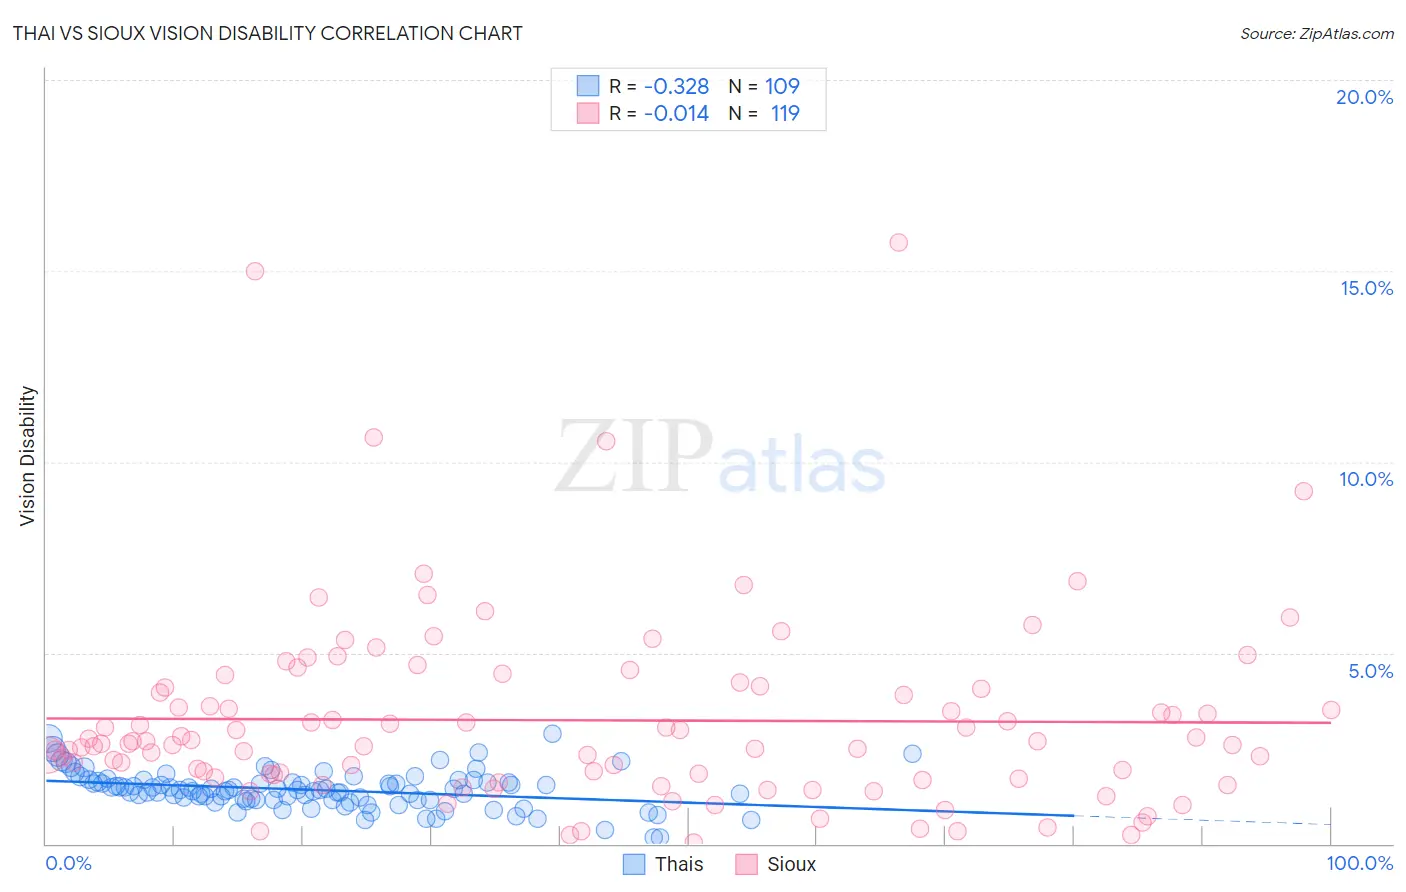
Thai vs Sioux Vision Disability Correlation Chart
The statistical analysis conducted on geographies consisting of 475,304,455 people shows a mild negative correlation between the proportion of Thais and percentage of population with vision disability in the United States with a correlation coefficient (R) of -0.328 and weighted average of 1.7%. Similarly, the statistical analysis conducted on geographies consisting of 234,049,152 people shows no correlation between the proportion of Sioux and percentage of population with vision disability in the United States with a correlation coefficient (R) of -0.014 and weighted average of 2.5%, a difference of 41.6%.
Vision Disability Correlation Summary
| Measurement | Thai | Sioux |
| Minimum | 0.17% | 0.034% |
| Maximum | 2.9% | 15.7% |
| Range | 2.7% | 15.7% |
| Mean | 1.4% | 3.2% |
| Median | 1.4% | 2.6% |
| Interquartile 25% (IQ1) | 1.2% | 1.7% |
| Interquartile 75% (IQ3) | 1.6% | 4.1% |
| Interquartile Range (IQR) | 0.47% | 2.3% |
| Standard Deviation (Sample) | 0.49% | 2.5% |
| Standard Deviation (Population) | 0.48% | 2.5% |
Similar Demographics by Vision Disability
Demographics Similar to Thais by Vision Disability
In terms of vision disability, the demographic groups most similar to Thais are Okinawan (1.8%, a difference of 1.9%), Immigrants from Iran (1.8%, a difference of 2.5%), Immigrants from South Central Asia (1.8%, a difference of 2.6%), Immigrants from Taiwan (1.7%, a difference of 2.6%), and Iranian (1.8%, a difference of 2.7%).
| Demographics | Rating | Rank | Vision Disability |
| Immigrants | India | 100.0 /100 | #1 | Exceptional 1.7% |
| Filipinos | 100.0 /100 | #2 | Exceptional 1.7% |
| Immigrants | Taiwan | 100.0 /100 | #3 | Exceptional 1.7% |
| Thais | 100.0 /100 | #4 | Exceptional 1.7% |
| Okinawans | 100.0 /100 | #5 | Exceptional 1.8% |
| Immigrants | Iran | 100.0 /100 | #6 | Exceptional 1.8% |
| Immigrants | South Central Asia | 100.0 /100 | #7 | Exceptional 1.8% |
| Iranians | 100.0 /100 | #8 | Exceptional 1.8% |
| Immigrants | Singapore | 100.0 /100 | #9 | Exceptional 1.8% |
| Immigrants | Hong Kong | 100.0 /100 | #10 | Exceptional 1.8% |
| Immigrants | Israel | 100.0 /100 | #11 | Exceptional 1.8% |
| Immigrants | Korea | 100.0 /100 | #12 | Exceptional 1.8% |
| Immigrants | Eastern Asia | 100.0 /100 | #13 | Exceptional 1.8% |
| Immigrants | China | 100.0 /100 | #14 | Exceptional 1.8% |
| Immigrants | Bolivia | 100.0 /100 | #15 | Exceptional 1.8% |
Demographics Similar to Sioux by Vision Disability
In terms of vision disability, the demographic groups most similar to Sioux are Immigrants from Central America (2.5%, a difference of 0.010%), Yakama (2.5%, a difference of 0.030%), Honduran (2.5%, a difference of 0.14%), French American Indian (2.5%, a difference of 0.17%), and Puget Sound Salish (2.5%, a difference of 0.31%).
| Demographics | Rating | Rank | Vision Disability |
| Nepalese | 0.0 /100 | #279 | Tragic 2.4% |
| Cape Verdeans | 0.0 /100 | #280 | Tragic 2.4% |
| U.S. Virgin Islanders | 0.0 /100 | #281 | Tragic 2.5% |
| Immigrants | Caribbean | 0.0 /100 | #282 | Tragic 2.5% |
| Puget Sound Salish | 0.0 /100 | #283 | Tragic 2.5% |
| Yakama | 0.0 /100 | #284 | Tragic 2.5% |
| Immigrants | Central America | 0.0 /100 | #285 | Tragic 2.5% |
| Sioux | 0.0 /100 | #286 | Tragic 2.5% |
| Hondurans | 0.0 /100 | #287 | Tragic 2.5% |
| French American Indians | 0.0 /100 | #288 | Tragic 2.5% |
| Immigrants | Nonimmigrants | 0.0 /100 | #289 | Tragic 2.5% |
| Immigrants | Cuba | 0.0 /100 | #290 | Tragic 2.5% |
| Immigrants | Honduras | 0.0 /100 | #291 | Tragic 2.5% |
| Crow | 0.0 /100 | #292 | Tragic 2.5% |
| Yaqui | 0.0 /100 | #293 | Tragic 2.5% |