Ute vs Immigrants from Austria Vision Disability
COMPARE
Ute
Immigrants from Austria
Vision Disability
Vision Disability Comparison
Ute
Immigrants from Austria
2.4%
VISION DISABILITY
0.1/ 100
METRIC RATING
267th/ 347
METRIC RANK
2.1%
VISION DISABILITY
94.4/ 100
METRIC RATING
103rd/ 347
METRIC RANK
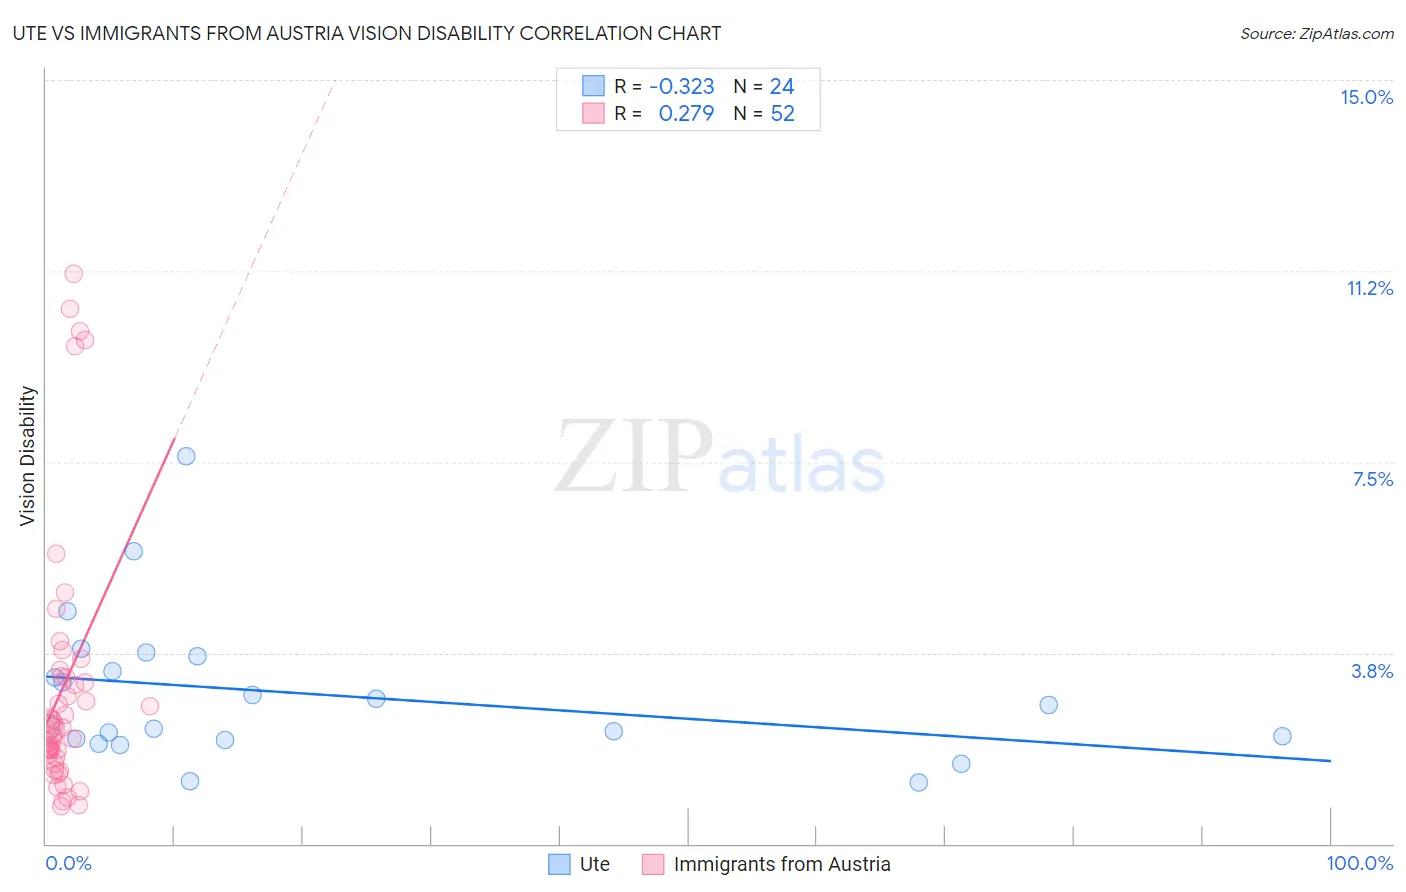
Ute vs Immigrants from Austria Vision Disability Correlation Chart
The statistical analysis conducted on geographies consisting of 55,653,653 people shows a mild negative correlation between the proportion of Ute and percentage of population with vision disability in the United States with a correlation coefficient (R) of -0.323 and weighted average of 2.4%. Similarly, the statistical analysis conducted on geographies consisting of 167,931,015 people shows a weak positive correlation between the proportion of Immigrants from Austria and percentage of population with vision disability in the United States with a correlation coefficient (R) of 0.279 and weighted average of 2.1%, a difference of 15.9%.
Vision Disability Correlation Summary
| Measurement | Ute | Immigrants from Austria |
| Minimum | 1.2% | 0.74% |
| Maximum | 7.6% | 11.2% |
| Range | 6.4% | 10.4% |
| Mean | 2.9% | 3.1% |
| Median | 2.5% | 2.3% |
| Interquartile 25% (IQ1) | 2.1% | 1.7% |
| Interquartile 75% (IQ3) | 3.5% | 3.3% |
| Interquartile Range (IQR) | 1.5% | 1.5% |
| Standard Deviation (Sample) | 1.5% | 2.6% |
| Standard Deviation (Population) | 1.4% | 2.6% |
Similar Demographics by Vision Disability
Demographics Similar to Ute by Vision Disability
In terms of vision disability, the demographic groups most similar to Ute are Mexican American Indian (2.4%, a difference of 0.010%), Immigrants from Jamaica (2.4%, a difference of 0.050%), Immigrants from Liberia (2.4%, a difference of 0.080%), Senegalese (2.4%, a difference of 0.090%), and Immigrants from Belize (2.4%, a difference of 0.20%).
| Demographics | Rating | Rank | Vision Disability |
| Belizeans | 0.2 /100 | #260 | Tragic 2.4% |
| Fijians | 0.1 /100 | #261 | Tragic 2.4% |
| Jamaicans | 0.1 /100 | #262 | Tragic 2.4% |
| Immigrants | Belize | 0.1 /100 | #263 | Tragic 2.4% |
| Immigrants | Liberia | 0.1 /100 | #264 | Tragic 2.4% |
| Immigrants | Jamaica | 0.1 /100 | #265 | Tragic 2.4% |
| Mexican American Indians | 0.1 /100 | #266 | Tragic 2.4% |
| Ute | 0.1 /100 | #267 | Tragic 2.4% |
| Senegalese | 0.1 /100 | #268 | Tragic 2.4% |
| Celtics | 0.1 /100 | #269 | Tragic 2.4% |
| Cubans | 0.1 /100 | #270 | Tragic 2.4% |
| Immigrants | Azores | 0.1 /100 | #271 | Tragic 2.4% |
| Spaniards | 0.1 /100 | #272 | Tragic 2.4% |
| Immigrants | Bahamas | 0.1 /100 | #273 | Tragic 2.4% |
| Immigrants | Latin America | 0.0 /100 | #274 | Tragic 2.4% |
Demographics Similar to Immigrants from Austria by Vision Disability
In terms of vision disability, the demographic groups most similar to Immigrants from Austria are Immigrants from Italy (2.1%, a difference of 0.010%), Carpatho Rusyn (2.1%, a difference of 0.020%), Swedish (2.1%, a difference of 0.070%), Danish (2.1%, a difference of 0.070%), and Korean (2.1%, a difference of 0.10%).
| Demographics | Rating | Rank | Vision Disability |
| Romanians | 95.7 /100 | #96 | Exceptional 2.1% |
| Immigrants | Afghanistan | 95.6 /100 | #97 | Exceptional 2.1% |
| Immigrants | South Africa | 95.4 /100 | #98 | Exceptional 2.1% |
| Estonians | 95.3 /100 | #99 | Exceptional 2.1% |
| Greeks | 95.1 /100 | #100 | Exceptional 2.1% |
| Albanians | 94.9 /100 | #101 | Exceptional 2.1% |
| Sri Lankans | 94.8 /100 | #102 | Exceptional 2.1% |
| Immigrants | Austria | 94.4 /100 | #103 | Exceptional 2.1% |
| Immigrants | Italy | 94.4 /100 | #104 | Exceptional 2.1% |
| Carpatho Rusyns | 94.3 /100 | #105 | Exceptional 2.1% |
| Swedes | 94.2 /100 | #106 | Exceptional 2.1% |
| Danes | 94.2 /100 | #107 | Exceptional 2.1% |
| Koreans | 94.1 /100 | #108 | Exceptional 2.1% |
| Chileans | 94.0 /100 | #109 | Exceptional 2.1% |
| Immigrants | Armenia | 93.8 /100 | #110 | Exceptional 2.1% |