Ute vs Immigrants from Portugal Vision Disability
COMPARE
Ute
Immigrants from Portugal
Vision Disability
Vision Disability Comparison
Ute
Immigrants from Portugal
2.4%
VISION DISABILITY
0.1/ 100
METRIC RATING
267th/ 347
METRIC RANK
2.3%
VISION DISABILITY
1.4/ 100
METRIC RATING
237th/ 347
METRIC RANK
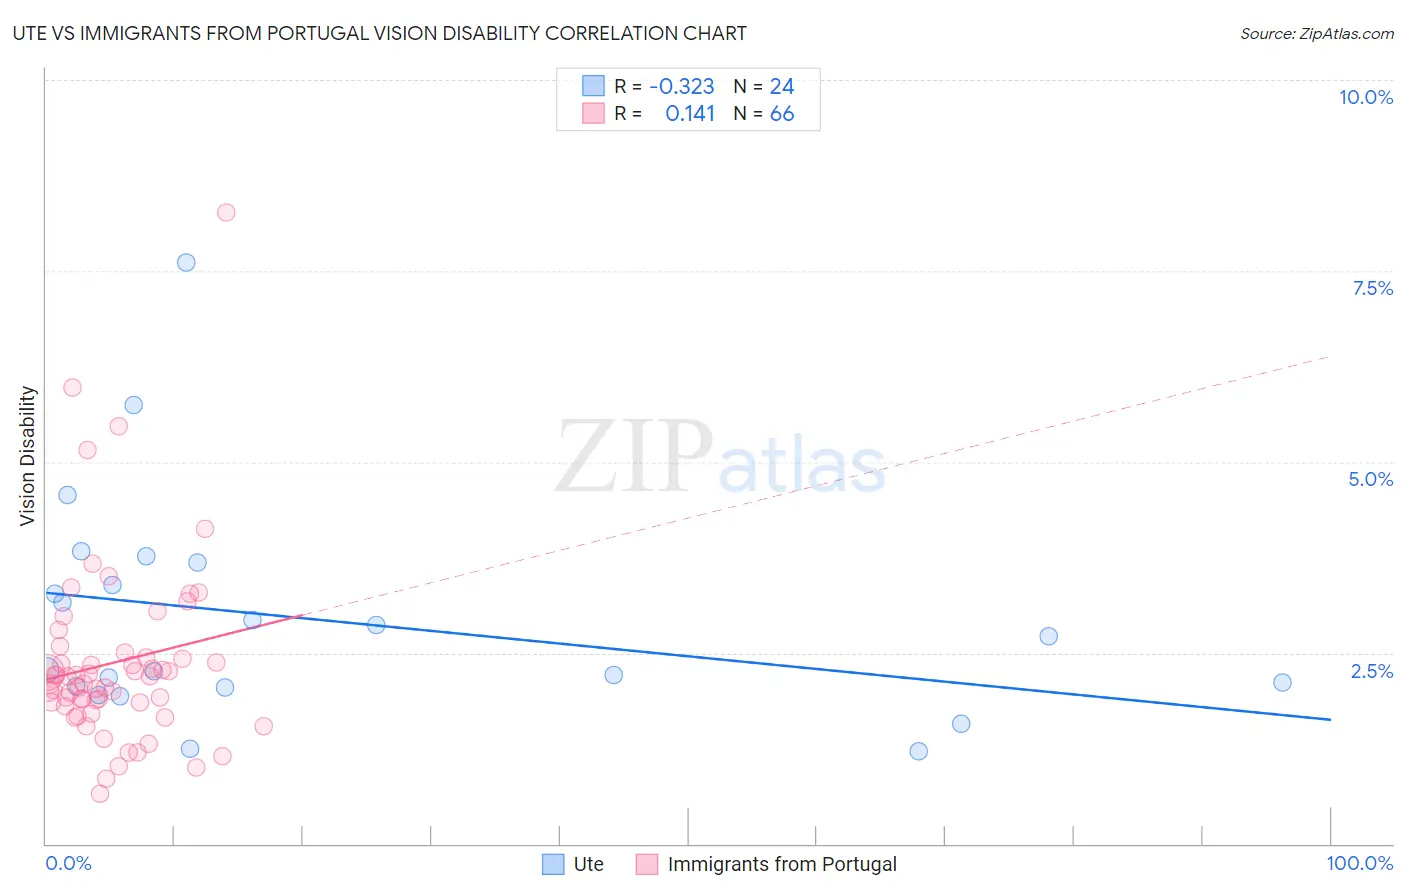
Ute vs Immigrants from Portugal Vision Disability Correlation Chart
The statistical analysis conducted on geographies consisting of 55,653,653 people shows a mild negative correlation between the proportion of Ute and percentage of population with vision disability in the United States with a correlation coefficient (R) of -0.323 and weighted average of 2.4%. Similarly, the statistical analysis conducted on geographies consisting of 174,661,842 people shows a poor positive correlation between the proportion of Immigrants from Portugal and percentage of population with vision disability in the United States with a correlation coefficient (R) of 0.141 and weighted average of 2.3%, a difference of 3.8%.
Vision Disability Correlation Summary
| Measurement | Ute | Immigrants from Portugal |
| Minimum | 1.2% | 0.66% |
| Maximum | 7.6% | 8.3% |
| Range | 6.4% | 7.6% |
| Mean | 2.9% | 2.4% |
| Median | 2.5% | 2.1% |
| Interquartile 25% (IQ1) | 2.1% | 1.8% |
| Interquartile 75% (IQ3) | 3.5% | 2.4% |
| Interquartile Range (IQR) | 1.5% | 0.59% |
| Standard Deviation (Sample) | 1.5% | 1.2% |
| Standard Deviation (Population) | 1.4% | 1.2% |
Similar Demographics by Vision Disability
Demographics Similar to Ute by Vision Disability
In terms of vision disability, the demographic groups most similar to Ute are Mexican American Indian (2.4%, a difference of 0.010%), Immigrants from Jamaica (2.4%, a difference of 0.050%), Immigrants from Liberia (2.4%, a difference of 0.080%), Senegalese (2.4%, a difference of 0.090%), and Immigrants from Belize (2.4%, a difference of 0.20%).
| Demographics | Rating | Rank | Vision Disability |
| Belizeans | 0.2 /100 | #260 | Tragic 2.4% |
| Fijians | 0.1 /100 | #261 | Tragic 2.4% |
| Jamaicans | 0.1 /100 | #262 | Tragic 2.4% |
| Immigrants | Belize | 0.1 /100 | #263 | Tragic 2.4% |
| Immigrants | Liberia | 0.1 /100 | #264 | Tragic 2.4% |
| Immigrants | Jamaica | 0.1 /100 | #265 | Tragic 2.4% |
| Mexican American Indians | 0.1 /100 | #266 | Tragic 2.4% |
| Ute | 0.1 /100 | #267 | Tragic 2.4% |
| Senegalese | 0.1 /100 | #268 | Tragic 2.4% |
| Celtics | 0.1 /100 | #269 | Tragic 2.4% |
| Cubans | 0.1 /100 | #270 | Tragic 2.4% |
| Immigrants | Azores | 0.1 /100 | #271 | Tragic 2.4% |
| Spaniards | 0.1 /100 | #272 | Tragic 2.4% |
| Immigrants | Bahamas | 0.1 /100 | #273 | Tragic 2.4% |
| Immigrants | Latin America | 0.0 /100 | #274 | Tragic 2.4% |
Demographics Similar to Immigrants from Portugal by Vision Disability
In terms of vision disability, the demographic groups most similar to Immigrants from Portugal are Immigrants from Congo (2.3%, a difference of 0.050%), Marshallese (2.3%, a difference of 0.14%), Scottish (2.3%, a difference of 0.21%), Immigrants from Cambodia (2.3%, a difference of 0.27%), and English (2.3%, a difference of 0.29%).
| Demographics | Rating | Rank | Vision Disability |
| Nicaraguans | 2.2 /100 | #230 | Tragic 2.3% |
| Immigrants | Ecuador | 2.0 /100 | #231 | Tragic 2.3% |
| German Russians | 1.8 /100 | #232 | Tragic 2.3% |
| Central Americans | 1.8 /100 | #233 | Tragic 2.3% |
| Scottish | 1.6 /100 | #234 | Tragic 2.3% |
| Marshallese | 1.5 /100 | #235 | Tragic 2.3% |
| Immigrants | Congo | 1.4 /100 | #236 | Tragic 2.3% |
| Immigrants | Portugal | 1.4 /100 | #237 | Tragic 2.3% |
| Immigrants | Cambodia | 1.1 /100 | #238 | Tragic 2.3% |
| English | 1.1 /100 | #239 | Tragic 2.3% |
| Panamanians | 0.9 /100 | #240 | Tragic 2.3% |
| Malaysians | 0.9 /100 | #241 | Tragic 2.3% |
| Immigrants | Panama | 0.8 /100 | #242 | Tragic 2.3% |
| Immigrants | Nicaragua | 0.6 /100 | #243 | Tragic 2.3% |
| Immigrants | West Indies | 0.6 /100 | #244 | Tragic 2.3% |