Ute vs Immigrants from Cuba Vision Disability
COMPARE
Ute
Immigrants from Cuba
Vision Disability
Vision Disability Comparison
Ute
Immigrants from Cuba
2.4%
VISION DISABILITY
0.1/ 100
METRIC RATING
267th/ 347
METRIC RANK
2.5%
VISION DISABILITY
0.0/ 100
METRIC RATING
290th/ 347
METRIC RANK
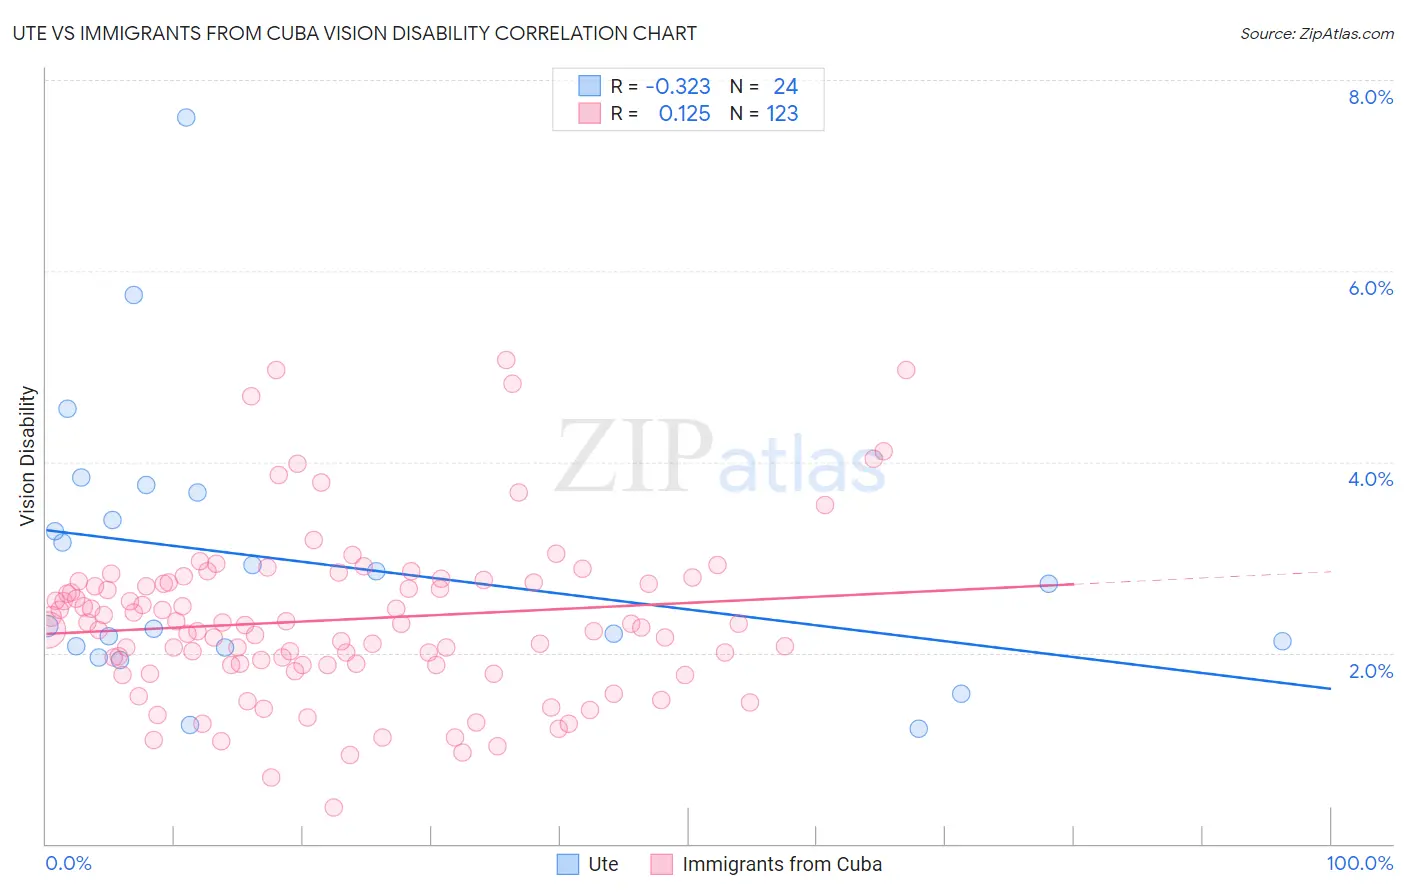
Ute vs Immigrants from Cuba Vision Disability Correlation Chart
The statistical analysis conducted on geographies consisting of 55,653,653 people shows a mild negative correlation between the proportion of Ute and percentage of population with vision disability in the United States with a correlation coefficient (R) of -0.323 and weighted average of 2.4%. Similarly, the statistical analysis conducted on geographies consisting of 325,877,901 people shows a poor positive correlation between the proportion of Immigrants from Cuba and percentage of population with vision disability in the United States with a correlation coefficient (R) of 0.125 and weighted average of 2.5%, a difference of 3.5%.
Vision Disability Correlation Summary
| Measurement | Ute | Immigrants from Cuba |
| Minimum | 1.2% | 0.38% |
| Maximum | 7.6% | 5.1% |
| Range | 6.4% | 4.7% |
| Mean | 2.9% | 2.3% |
| Median | 2.5% | 2.3% |
| Interquartile 25% (IQ1) | 2.1% | 1.9% |
| Interquartile 75% (IQ3) | 3.5% | 2.7% |
| Interquartile Range (IQR) | 1.5% | 0.87% |
| Standard Deviation (Sample) | 1.5% | 0.87% |
| Standard Deviation (Population) | 1.4% | 0.87% |
Similar Demographics by Vision Disability
Demographics Similar to Ute by Vision Disability
In terms of vision disability, the demographic groups most similar to Ute are Mexican American Indian (2.4%, a difference of 0.010%), Immigrants from Jamaica (2.4%, a difference of 0.050%), Immigrants from Liberia (2.4%, a difference of 0.080%), Senegalese (2.4%, a difference of 0.090%), and Immigrants from Belize (2.4%, a difference of 0.20%).
| Demographics | Rating | Rank | Vision Disability |
| Belizeans | 0.2 /100 | #260 | Tragic 2.4% |
| Fijians | 0.1 /100 | #261 | Tragic 2.4% |
| Jamaicans | 0.1 /100 | #262 | Tragic 2.4% |
| Immigrants | Belize | 0.1 /100 | #263 | Tragic 2.4% |
| Immigrants | Liberia | 0.1 /100 | #264 | Tragic 2.4% |
| Immigrants | Jamaica | 0.1 /100 | #265 | Tragic 2.4% |
| Mexican American Indians | 0.1 /100 | #266 | Tragic 2.4% |
| Ute | 0.1 /100 | #267 | Tragic 2.4% |
| Senegalese | 0.1 /100 | #268 | Tragic 2.4% |
| Celtics | 0.1 /100 | #269 | Tragic 2.4% |
| Cubans | 0.1 /100 | #270 | Tragic 2.4% |
| Immigrants | Azores | 0.1 /100 | #271 | Tragic 2.4% |
| Spaniards | 0.1 /100 | #272 | Tragic 2.4% |
| Immigrants | Bahamas | 0.1 /100 | #273 | Tragic 2.4% |
| Immigrants | Latin America | 0.0 /100 | #274 | Tragic 2.4% |
Demographics Similar to Immigrants from Cuba by Vision Disability
In terms of vision disability, the demographic groups most similar to Immigrants from Cuba are Nonimmigrants (2.5%, a difference of 0.14%), Immigrants from Honduras (2.5%, a difference of 0.39%), Crow (2.5%, a difference of 0.49%), Yaqui (2.5%, a difference of 0.52%), and French American Indian (2.5%, a difference of 0.55%).
| Demographics | Rating | Rank | Vision Disability |
| Puget Sound Salish | 0.0 /100 | #283 | Tragic 2.5% |
| Yakama | 0.0 /100 | #284 | Tragic 2.5% |
| Immigrants | Central America | 0.0 /100 | #285 | Tragic 2.5% |
| Sioux | 0.0 /100 | #286 | Tragic 2.5% |
| Hondurans | 0.0 /100 | #287 | Tragic 2.5% |
| French American Indians | 0.0 /100 | #288 | Tragic 2.5% |
| Immigrants | Nonimmigrants | 0.0 /100 | #289 | Tragic 2.5% |
| Immigrants | Cuba | 0.0 /100 | #290 | Tragic 2.5% |
| Immigrants | Honduras | 0.0 /100 | #291 | Tragic 2.5% |
| Crow | 0.0 /100 | #292 | Tragic 2.5% |
| Yaqui | 0.0 /100 | #293 | Tragic 2.5% |
| Ottawa | 0.0 /100 | #294 | Tragic 2.5% |
| Delaware | 0.0 /100 | #295 | Tragic 2.5% |
| Immigrants | Mexico | 0.0 /100 | #296 | Tragic 2.5% |
| Immigrants | Dominica | 0.0 /100 | #297 | Tragic 2.5% |